Comparative Study
. 1992;2(4):409-23.

Characterization of two types of ribosomal gene transcription in Xenopus laevis oocytes

Affiliations
Comparative Study

Characterization of two types of ribosomal gene transcription in Xenopus laevis oocytes

P Labhart. Gene Expr. 1992.

Abstract

When the germinal vesicle of Xenopus laevis oocytes is translocated into the vegetal hemisphere by centrifugation, the normally silent ribosomal spacer promoters are strongly induced. This induction correlates with the permeability of the nuclear envelope to dextran of molecular weight 70 kDa, thus raising the possibility that the transcriptional changes are due to mixing of nuclear and cytoplasmic components. This basic observation prompted a thorough investigation of ribosomal gene transcription in centrifuged oocytes which had the germinal vesicle either in the animal half (A-oocytes) or in the vegetal half (V-oocytes). Two types of ribosomal gene transcription were characterized: (1) in A-oocytes, spacer promoters remain silent, transcription initiation is dependent on the upstream terminator T3, and transcription is highly processive and recognizes sites of RNA 3' end formation (like T2 and T3); (2) in V-oocytes, spacer promoters are induced, transcription initiation is independent of T3, but most transcripts terminate prematurely after less than 150 nt. Furthermore, the transcription machinery in V-oocytes does not respond to T2 or T3 signals. The implications of the present observations for our understanding of the regulation of the spacer promoters and of the function of the upstream terminator T3 are discussed.


Figures

Figure 1
Figure 1
Gene maps and location of probes. A. Partial map of a typical X. laevis ribosomal repeat unit. Relevant sites and the location of single-stranded M13 probes for the “reverse”-RNase protection assay (A, B, and C) and of single-stranded restriction fragments used as SI probes are indicated. The 32P-label at the 5′ end of the SI probes is shown as an open circle. The total length of the S1 probes and the expected protected length in nucleotides are given below the probes by the numbers after and before the slash, respectively. B. Map of the ribosomal minigene construct with the major functional sites and restriction sites. The SP6 probe for the RNase protection assay (solid arrow to the left) and the expected protected RNA fragments and their lengths in nucleotides (dashed arrows to the right) are shown. The S1 probe for detecting initiation at the minigene promoter is presented as in panel A.
Figure 2
Figure 2
Transcription initiation is T3-dependent in A-oocytes and T3-independent in V-oocytes. A. Induction of the spacer promoter upon centrifugation of the germinal vesicle into the vegetal hemisphere of the oocyte. SI analysis of RNA from oocytes that had been centrifuged with the animal pole up (Aoocytes, lane 2) or with the vegetal pole up (V-oocytes, lane 3). Lanes 5–8 show the analysis of oocytes centrifuged at intermediate positions between the extremes of animal pole up (0°, lane 4) and vegetal pole up (180°, lane 9). Lane 1 shows the result with uncentrifuged control oocytes. S1 analysis was with a mixture of a probe specific for the gene promoter and a probe specific for the spacer promoter (see Fig. 1A for location of probes). B. Injected cloned spacer promoters are co-regulated with the endogenous spacer promoters. S1 analysis of RNA from uninjected control oocytes (“minus” lanes) and from oocytes injected with a plasmid containing a spacer promoter (“plus” lanes). The S1 probe used (the same as in A) does not distinguish between the endogenous and the cloned spacer promoter. Note that in A-oocytes (lanes 1 and 2) the low level of spacer promoter activity is unchanged in the presence of the injected plasmid (lane 2), whereas in V-oocytes (lanes 3 and 4) the additional signal from the injected plasmid (lane 4) is clearly detectable over the signal from the induced endogenous spacer promoters. C. Transcription analysis of ribosomal promoters plus and minus T3 in A- and V-oocytes. Minigene plasmids with wild-type T3 (+T3 lanes) or mutated T3 (−T3 lanes) were injected into A- (lanes 1 and 3) and V-oocytes (lanes 2 and 4), and the RNA was analyzed with the SI protection assay. The construct and the SI probe used are shown in Figure 1B. Note that the promoter with the mutated T3 is only active in V-oocytes (lane 2), thus behaving like a spacer promoter.
Figure 3
Figure 3
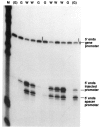
Spacer promoter activity in V-oocytes correlates with loss of nuclear location of injected dextran of 70 kDa. FITC-labeled dextran (along with a plasmid with mutated T3) was injected into nuclei of V-oocytes, and nuclear or cytoplasmic distribution was monitored after incubation for 18 hours. Individual oocytes were assayed with a mixture of S1 probes for the gene promoter, the spacer promoter, and the injected cloned promoter. G denotes presence of green color in the nucleus; W denotes white nucleus, i.e., loss of green color. (G) denotes light green color of the nucleus. Note the correlation between loss of nuclear distribution of the FITC-dextran and activation of both spacer promoter and a T3-less injected promoter.
Figure 4
Figure 4
V-oocytes are in a stable transcriptional state for several hours. A. A pair of minigenes, one with a wild-type T3 and one with a mutated T3, were co-injected immediately after centrifugation (lanes 1 and 2), and 1 hour (lanes 3 and 4), 3 hours (lanes 5 and 6), or 6 hours after centrifugation (lanes 7 and 8). Transcription from the two plasmids can be distinguished by the specific S1 probes used. The probe for the T3 mutated promoter is the one shown in Figure 1B (50 nucleotide protection for correctly initiated transcripts), whereas the probe for the T3-containing promoter is similar but gives a protection of 62 nucleotides (see Labhart and Reeder, 1985 for details). Note that the activation of the plasmid with mutated T3 (−T3) in V-oocytes is seen even when injected 6 hours after centrifugation. B. Time course of the accumulation of the spacer promoter transcripts in V-oocytes. S1 assay was as in Figure 2A. Time points analyzed in lanes 1–10 are 0.5,1,2,3,4, 6,9,24, and 24 hours. Note that spacer transcripts continue to accumulate after 9 hours.
Figure 5
Figure 5
T3 needs to be in its natural location for high promoter activity in A-oocytes. The following minigene constructs were injected into nuclei of A-oocytes: wild-type construct with T3 in its natural location (lanes 1 and 7), T3 mutant (lane 2), T3 deletion (5′–158; lanes 3 and 8), 112 bp push apart clone (lanes 4 and 10), 3.7 kb push apart clone (lanes 5 and 9). The construct assayed in lane 6 had the T3 site cloned 3.7 kb upstream from the promoter but in inverted orientation. For the precise structure of these push apart constructs, see Labhart and Reeder (1987b). The injected oocytes were analyzed either by S1 protection of total RNA (lanes 1–6) or by “reverse”-RNase protection analysis of nuclear run-on assays (lanes 7–10). For the S1 assays, the experimental plasmids were co-injected with a T3-containing control plasmid, and the RNA was assayed with probes specific for the experimental (50 nt protection) and the control plasmid (62 nt protection), as well as with the probe specific for the endogenous spacer promoter. Note that the push-apart constructs give an intermediate signal both in vivo in A-oocytes and upon in vitro transcription of germinal vesicles from injected A-oocytes.
Figure 6
Figure 6
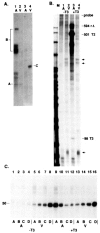
Transcription is very polar in V-oocytes. A. RNA was labeled in vivo by injection of [α-32P]CTP (along with α-amanitin) into A- and V-oocytes and analyzed with a “reverse”-RNase protection assay using single-stranded DNA probes from three different regions of the ribosomal gene repeat. In lanes 1 and 2, a mixture of a probe from the very 5′ end (probe A) and from the 3′ end of the 40S precursor coding region (probe B) was used. In lanes 3 and 4, a probe specific for the region of the spacer promoters was used (probe C). See Figure 1A for the location of the probes. Note that the signal obtained at the 3′ end of the gene (B) is much lower in V-oocytes, while the signal at the 5′ end (A) remains essentially unchanged. The spacer promoter is turned on in V-oocytes, consistent with the data shown in Figure 2A. B. Transcription analysis of ribosomal promoters plus and minus T3 in A- and V-oocytes. Mini-gene plasmids with wild-type T3 (+T3 lanes) or mutated T3 (−T3 lanes) were injected into A- (lanes 1 and 3) and V-oocytes (lanes 2 and 4), and RNA was analyzed with an RNase T1 protection assay. The SP6 RNA-probe used is shown in Figure 1B. Lane M shows an end-labeled Hpa II digest of pBR322. Arrows denote RNA-protection bands characteristic of the short transcripts in V-oocytes. Only a T3-containing promoter in A-oocytes gives rise to large amounts of long transcripts (lane 3). C. Size-fractionation of RNA synthesized from ribosomal promoters injected into A- and V-oocytes. The lengths of single-stranded DNA are larger than 450 nt in fraction A, 250–450 nt in fraction B, 145–250 nt in fraction C, and 60–145 nt in fraction D. RNA from the same four samples analyzed in Figure 2C was used. S1 assay of the fractionated RNA was with the same probe used in Figure 2C. Note that in V-oocytes the majority of the transcripts starting at the promoter are shorter than 150 nucleotides (fraction D; lanes 8 and 16).
Figure 7
Figure 7
Further characterization of A- and V-type ribosomal transcription. Plasmids with the basic structure shown below the autoradiographs were injected into A- and V-oocytes and analyzed either by RNase T1 protection assay (upper panel) or by S1 protection assay (lower panel). The mutations analyzed were: lanes 1 and 7, 5′ −90 promoter deletion mutant; lanes 2 and 8, promoter linker scanner mutant −142/−133; lanes 3 and 9, T3 mutation; lanes 4 and 10, all wild-type construct; lanes 5 and 11, C261 mutation of T2; lanes 6 and 12, G255 mutation of T2. Note that the promoter mutations show no transcription in both A- and V-oocytes, and that the T2 site (protection of 501 nt in lanes 4 and 5) is not recognized in V-oocytes (lanes 10–12). The gel has been overexposed in order to show the low amount of long transcripts in V-oocytes. (Some of the heterogenous bands in the upper panel [lanes 3–6] and the relatively strong SI signal of the T3 mutant in A-oocytes [lane 3] are probably due to contamination of the A-RNA samples with V-RNA.)

Similar articles

Cited by

References

    1. Bateman E. and Paule M. (1988), Cell 54, 985–992. - PubMed
    1. Boseley P., Moss T., Maechler M., Portmann R., and Birnstiel M. (1979), Cell 17, 19–31. - PubMed
    1. Botchan P., Reeder R. H., and Dawid I. B. (1977), Cell 11, 599–607. - PubMed
    1. De Winter R. F. J. and Moss T. (1986), Cell 44, 313–318. - PubMed
    1. Dingwall C. and Laskey R. A. (1986), Annu Rev Cell Biol 2, 367–390. - PubMed

Publication types