. 2003 Oct 29;1(1):2.
doi: 10.1186/1740-3391-1-2.

Transdisciplinary unifying implications of circadian findings in the 1950s

Affiliations

Transdisciplinary unifying implications of circadian findings in the 1950s

Franz Halberg et al. J Circadian Rhythms. .

Abstract

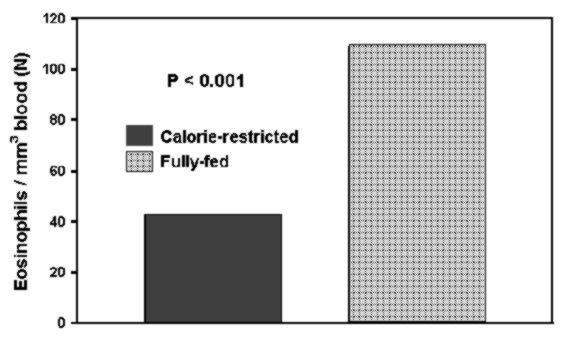
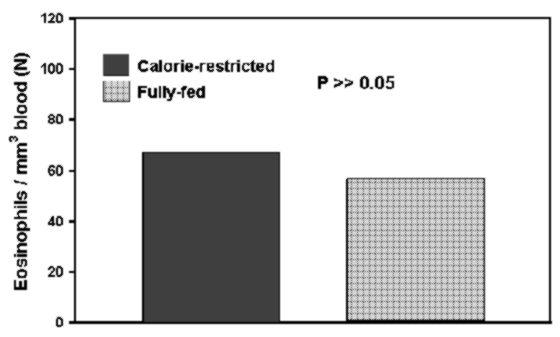
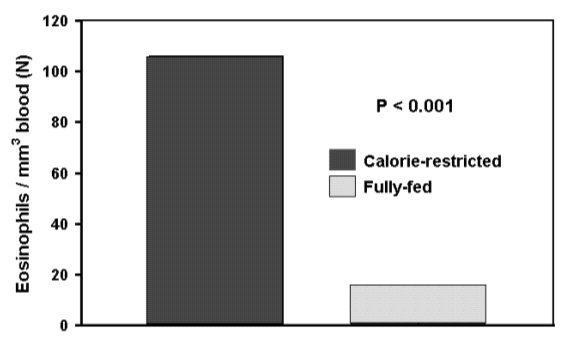
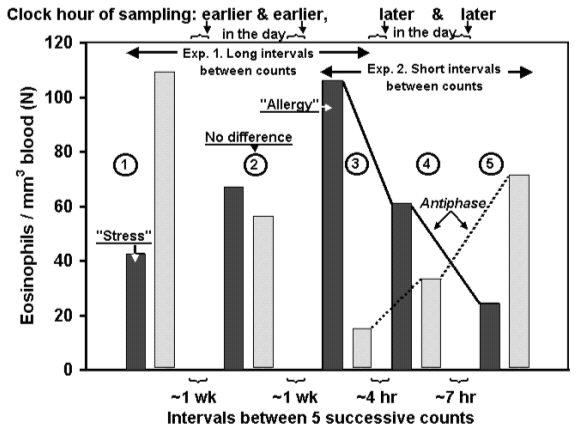
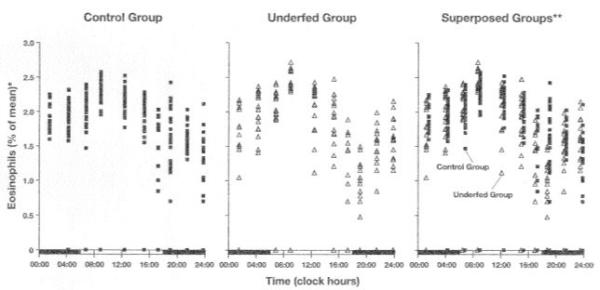
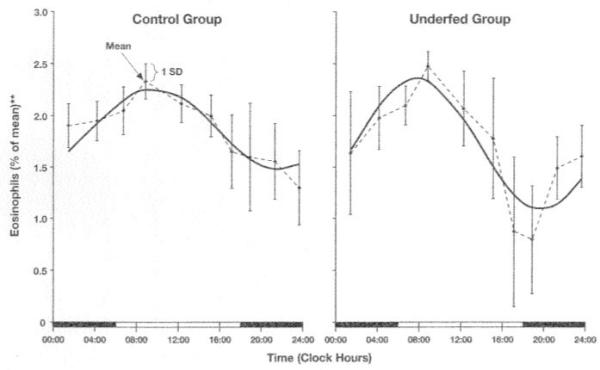
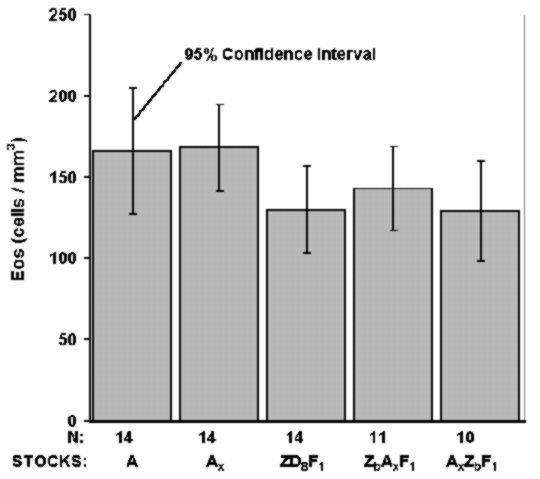
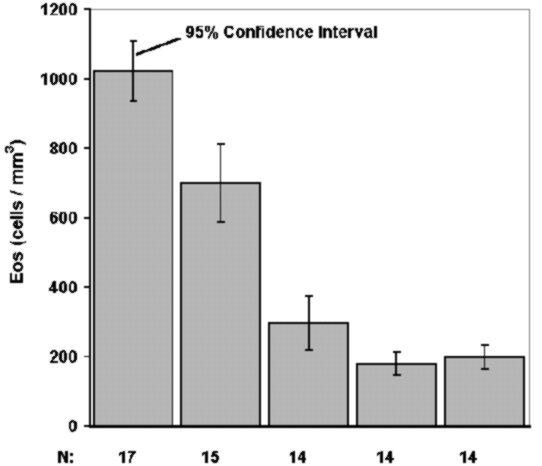
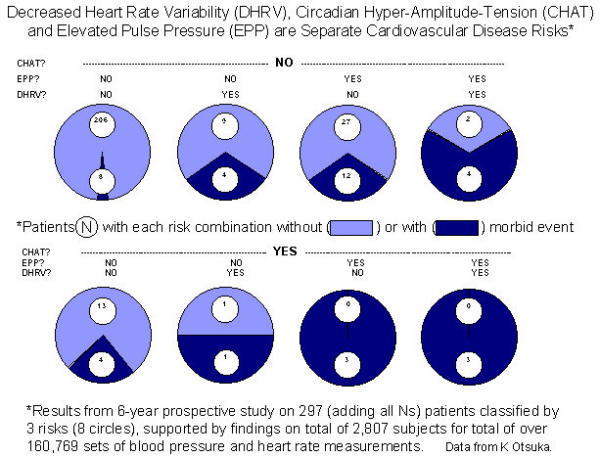
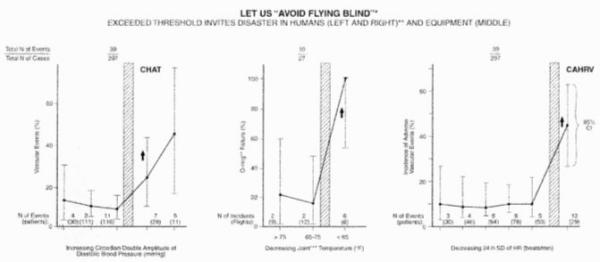
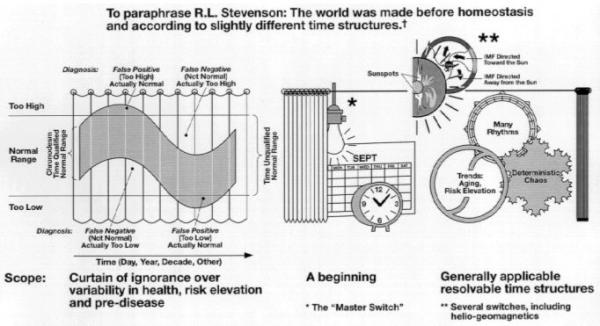
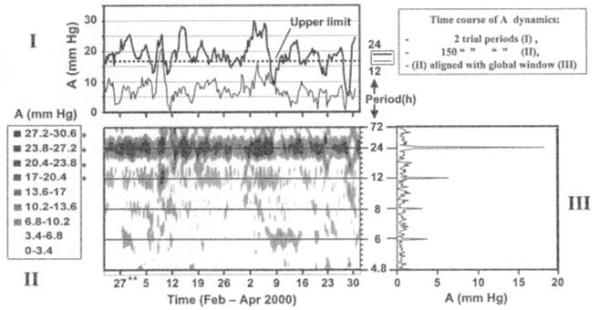
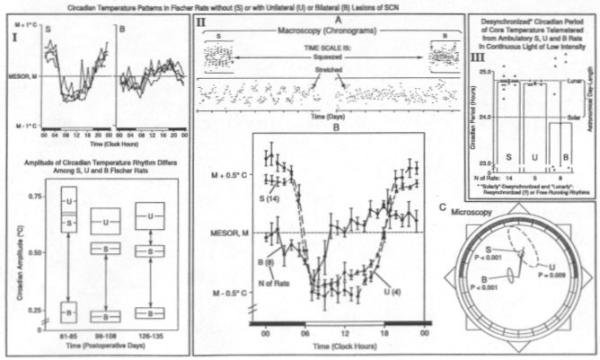
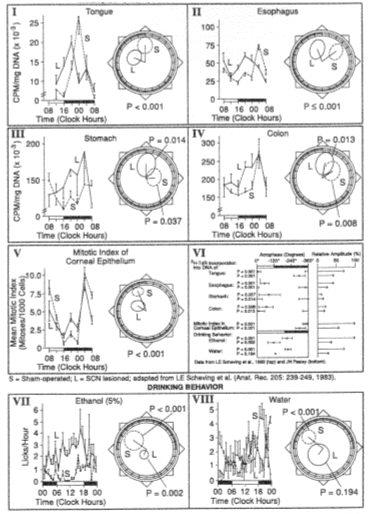
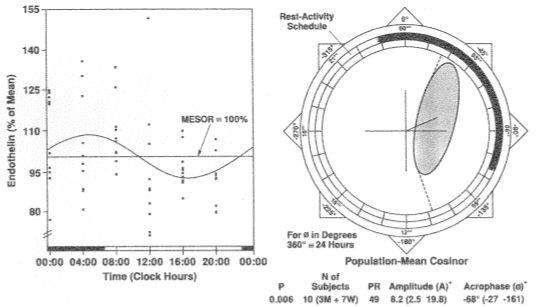
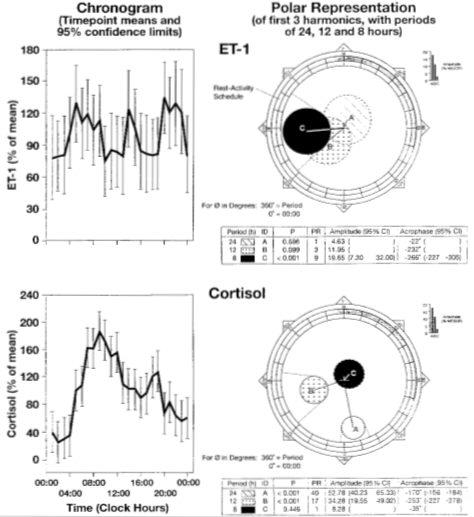
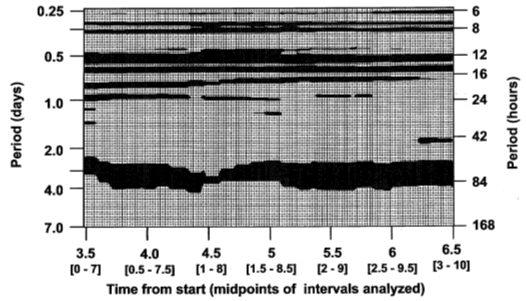
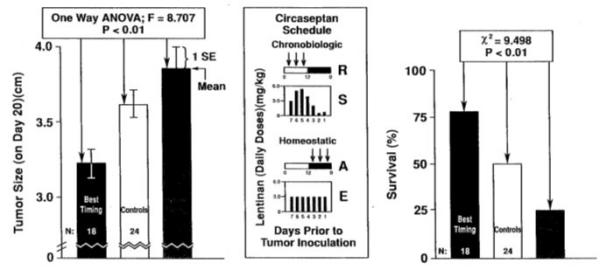
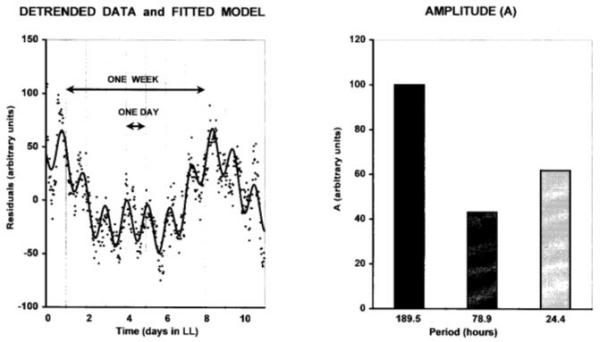
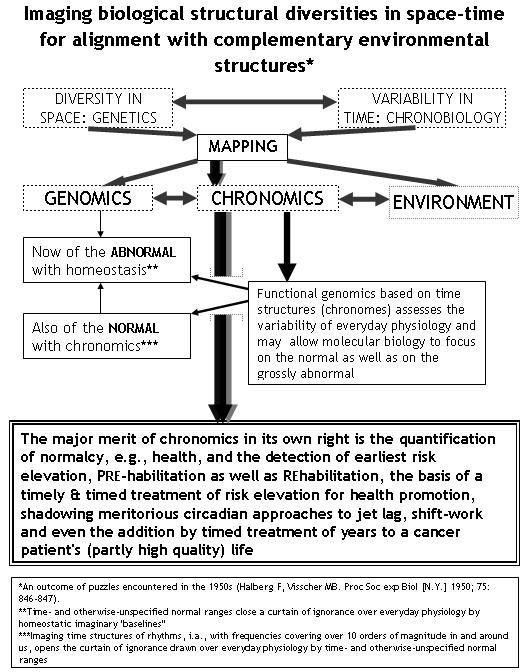
Afew puzzles relating to a small fraction of my endeavors in the 1950s are summarized herein, with answers to a few questions of the Editor-in-Chief, to suggest that the rules of variability in time complement the rules of genetics as a biological variability in space. I advocate to replace truisms such as a relative constancy or homeostasis, that have served bioscience very well for very long. They were never intended, however, to lower a curtain of ignorance over everyday physiology. In raising these curtains, we unveil a range of dynamics, resolvable in the data collection and as-one-goes analysis by computers built into smaller and smaller devices, for a continued self-surveillance of the normal and for an individualized detection of the abnormal. The current medical art based on spotchecks interpreted by reference to a time-unqualified normal range can become a science of time series with tests relating to the individual in inferential statistical terms. This is already doable for the case of blood pressure, but eventually should become possible for many other variables interpreted today only based on the quicksand of clinical trials on groups. These ignore individual differences and hence the individual's needs. Chronomics (mapping time structures) with the major aim of quantifying normalcy by dynamic reference values for detecting earliest risk elevation, also yields the dividend of allowing molecular biology to focus on the normal as well as on the grossly abnormal.


Figures

Figure 1
Figure 1
Eosinophil counts lowered by "fasting" and/or "stress". Effect of a 50% reduction in dietary carbohydrates and fats (with proteins, vitamins and minerals as in control group) in C3H mice with a high breast cancer incidence (not shown), which is greatly lowered by a diet reduced in calories. Is an adrenocortical activation, then assessed by eosinophil depression, an answer for treating breast cancer and for prolonging life? A large and exciting finding – a difference in eosinophil count between two groups of mice – was found, and of course it had to be replicated on a larger group of animals because of its importance to the etiology of cancer. Steroids that depress eosinophil cell counts and perhaps mitoses could be a mechanism through which caloric restriction and ovariectomy act in greatly reducing cancer incidence. This may be the mechanism to prevent breast cancer, or was this very reasonable and plausible hypothesis a premature extrapolation? (My chief had taken these results as a statistically significantly validated, most promising report to Paris.)
Figure 2
Figure 2
Confusing results one week later: follow-up with more animals starting at an earlier clock hour shows "no difference". A phase difference between the two groups was predicted. The large inter-group difference in eosinophil count was not replicated when more animals were used with an earlier start.
Figure 3
Figure 3
Opposite outcome observed another week later: has "stress" become "allergy"? Erroneous conclusions from ignoring a phase difference in circadian rhythm due to competing synchronization. Results from another follow-up with even more animals at a yet earlier clock hour. A difference in the opposite direction as compared to the difference observed first (Fig. 1) is noted.
Figure 4
Figure 4
Recognition of circadian phase difference between two groups of mice prevents the drawing of false conclusions. Light gray: fully-fed group; dark gray: calorie-restricted group. Two groups of C3H mice (with differing breast cancer incidence) compared at single but different clock hours, first at near-weekly intervals (1, 2 and 3) and then at about 4- and again about 7-hour intervals (4 and 5) on the same day. The first 3 samplings at weekly intervals were made at earlier and earlier clock hours on two groups whose circadians were in antiphase, since one was fed a calorie-restricted diet in the morning, while the other group was fed ad libitum and fed mostly during the nightly dark span. To validate this assumption, the final two samplings at about 4- and then at about 7-hour intervals on the same day showed, as anticipated, the predicted reversal of the inter-group difference. (A progressive lowering of count associated with repeated blood letting had been demonstrated separately.) The time of day of sampling was the same for the two groups compared, but it differed from comparison to comparison in Figs. 12,3 (circled 1, 2 and 3); this fact confounded the results, as documented by repeating sampling at different clock-hours on the same day (circled 4 and 5). This circumstance accounts for the different results in Figs. 1,2,3: 24-h synchronized rhythms were compared on the same lighting but on different feeding regimens, as we realized and then documented the dominant synchronizing role of feeding time (overcoming the effect of lighting) on a diet restricted in carbohydrates and fat by 50% [86].
Figure 5
Figure 5
Effect of food restriction on circulating eosinophils in mice. *After log10-transformation of data expressed as percentage of mean. **To reveal the difficulty to resolve differences by the naked eye alone, and the even greater difficulty of quantifying the patterns of each group and any inter-group differences. There is a need to cover the 24-hour time scale to look for intergroup differences in the face of a large variability, what the active Claude Bernard rightly called the "extreme variability of the internal environment" [264]. Our analysis of variance reveals statistically significant time and group effects and interaction in this time-macroscopic approach, shown elsewhere [303].
Figure 6
Figure 6
Food restriction amplifies circadian rhythm of circulating eosinophils in mice.*P < 0.001 from test of equality of amplitudes. ** After log10-transformation of data expressed as percentage of mean. Parameter estimations and comparisons can be derived from the fit of a 24-h cosine curve (shown with original timepoint mean values ± 1 standard deviation). Circulating eosinophil counts of the underfed group are lower (P<0.001) than those of the control group. The circadian pattern of the underfed group has a larger amplitude (P<0.001) and an earlier acrophase (P=0.003) as compared to that of the control group. This microscopic approach quantifies the effect of food restriction upon the eosinophil counts, also documented by an analysis of variance as a statistically significant time-group interaction [303].
Figure 7
Figure 7
Genetic uniformity in averages? (spurious in the light of more stocks examined). Data on eosinophil counts (Eos) in five stocks of mice (from Halberg et al. J Hematology 6: 832–837, 1951; cf. Proc Soc Exp Biol & Med 75: 844–847, 1950). Mice kept in L6-18D18-6. Sampling during fixed clock hours: 06:00 – 10:00. When the time of day of sampling is fixed along with the lighting and feeding regimens, seemingly reproducible results are obtained on five stocks of mice, namely the A strain (with the mammary cancer agent [MCA]) and the A× (foster-nursed without the MCA), and various first-generation hybrids of the C3H mice (Z with and Zb without the MCA) and the Dilute Brown subline 8 (D8 with the MCA) mice, again a premature extrapolation.
Figure 8
Figure 8
Genetic diversity in averages requiring complementary examination of further genetic diversity in variability as such and of diversities in time. Data on eosinophil counts (Eos) in five stocks of mice (from Halberg et al. J hematology 6: 832–837, 1951; cf. Proc Soc Exp Biol & Med 75: 844–847, 1950). Mice kept in L6-18D18-6. Sampling during fixed clock hours: 06:00 – 10:00. Concurrent study of additional stocks at the same fixed time of day reveals differences in mean value.
Figure 9
Figure 9
Genetic diversity in variability as such, gauged by coefficient of variation (CV). Beyond genetic diversity in averages of eosinophil counts in five stocks of mice (from Halberg et al. J Hematology 6: 832–837, 1951; cf. Proc Soc Exp Biol & med 75: 844–847, 1950). Mice kept in L6-18D18-6. Sampling during fixed clock hours: 06:00 – 10:00. Prediction limits, derived from first 5 stocks of mice, are exceeded when 5 additional stocks are examined (hatched). Of interest with the genetic diversity in space among different stocks of mice (Fig. 8) is a genetic diversity in the coefficient of variation.
Figure 10
Figure 10
Circadian physiological variation in murine eosinophil counts (Eos). In four inbred strains and a hybrid (F1) stock (F Halberg and M Visscher. Proc Soc Exp Biol & med 75: 844–847, 1950). Note 1. Large genetic differences, gauged by one-way ANOVA across stocks at 08:00 (F=43.1; P < 0.001) and 00:00 (F=21.3; P < 0.001) representing differences in genome, and 2. Equally impressive diversity in time, in each stock, gauged by 08:00 vs. 00:00 difference, approximating, by only two timepoints, circadian component of chronome (t=11.3; P < 0.001 from paired t-test of relative 08:00 vs. 00:00 differences, expressed as percent of mean). The ever-present within-day difference can differ among stocks of mice.
Figure 11
Figure 11
Sex difference in circadian rhythm of circulating eosinophil counts (Eos) of mature C57 subline 1 mice. Data on eosinophil counts (Halberg et al. Science 125: 73, 1957). PR = percentage rhythm (proportion of variance accounted for by fitted 24-hour cosine curve). Solid lines: one-component model; dashed lines: two-component model. Sex differences in MESOR found with attention to strain and rhythm.
Figure 12
Figure 12
Cost and quality trade-offs (left) or instrumented self-help for health improvement (right) concerning blood pressure. Challenge to engineers, to civil servants dispensing government resources, and to each individual interested in self-help. Investment into physiological monitoring and education in chronobiology, to detect warning signs indicative of an elevated risk, rather than only of the fait accompli of disease, can prompt preventive intervention with the goal of avoiding the crippling of catastrophic diseases, also a major drain on financial resources. By placing added emphasis on prevention by general education in chronomic self-monitoring, health care costs could decrease while quality of care is individualized and improved [8,9].
Figure 13
Figure 13
Clinical studies with timing by peak tumor temperature show faster regression and doubling of 2-year disease-free survival of patients with cancer of the oral cavity.
Figure 14
Figure 14
Gain in chronochemotherapy cures in the experimental laboratory in two different investigations [239-241].
Figure 15
Figure 15
The incidence of morbidity among 121 normotensive and 176 treated hypertensive patients (so diagnosed by their time structure or chronome-adjusted mean, MESOR) with no cardiovascular disease at the outset is compared in a 6-year prospective study among patients presenting without or with 1, 2 or all 3 of 3 risks factors. The risk factors considered are:1. CHAT (brief for circadian hyper-amplitude-tension), a condition characterized by an excessive circadian amplitude of (diastolic) blood pressure (above the upper 95% prediction limit of clinically healthy peers of the same gender and a similar age);2. An elevated pulse pressure (EPP), defined as a difference between the MESORs of systolic and diastolic blood pressure above 60 mmHg; and 3. Decreased heart rate variability (DHRV), defined as a standard deviation of heart rate measurements at 15-min intervals for 48 hours in the lowest 7th percentile of the patient population. Risk was determined at the start of study, based on a 48-hour profile (acceptable for group studies only, one week's monitoring at 30-minute intervals being recommended for individuals) of automatic measurements of blood pressure and heart rate at 15-min intervals with an ambulatory monitor. Morbidity was checked about 6-monthly thereafter. Diagnoses considered were: coronary artery disease, cerebral ischemic events, nephropathy and retinopathy (related to blood pressure disorder). After 6 years, morbidity was diagnosed in 39 of the 297 patients. In the reference population of 214 patients presenting none of the 3 risk factors, morbidity was found in 8 cases (3.7%) (top left). The presence of DRHV or EPP alone raises the incidence of morbidity to 30.8% (top middle). When these two risks are both present, morbidity is doubled (66.7%) (top right). The presence of CHAT (bottom) invariably increases the incidence of morbidity, from 3.7% to 23.5% in the absence of the other two risk factors (bottom left), from 30.8% to 50% or 100% when either DHRV or EPP is also present (bottom middle), or from 66.7% to 100% when all 3 risk factors are present (bottom right). Except for a weak relation between pulse pressure and the standard deviation of heart rate, the 3 risk factors are mostly separate and additive. The results suggest the desirability to routinely assess blood pressure variability in addition to heart rate variability since even in MESOR-normotension, CHAT is associated with a statistically significant increase in cardiovascular disease risk (not shown) [8], and can be successfully treated [80]. Whereas the number of morbid events and the number of patients in this study are small, the results are supported by several other prospective and retrospective chronobiological investigations [8,38,78-82].
Figure 16
Figure 16
Disaster can result from literally and figuratively neglecting the range of operational environmental temperatures or in biology, the "normal range". For a relatively wide range of temperatures, a piece of equipment may be safe to use, but once temperature drops below a threshold, the likelihood of problems increases. The situation that led to the Challenger disaster (middle) is compared with the non-linear elevation of cardiovascular disease risk associated with a decreased heart rate variability (gauged by the standard deviation) (right) and also with an overswinging of blood pressure (CHAT) (left), also exhibiting a nonlinear behavior. Note that the increase in morbid events follows only after a threshold is exceeded, a nonlinear behavior that may have delayed the recognition of these risks. The use of chronomics is particularly indicated in populations at a high vascular disease risk.
Figure 17
Figure 17
Efficacy, safety and cost-effectiveness of chronotherapy (CT) versus traditional therapy (TT) with propranolol. Twenty patients per group; hypotensive effect is more pronounced on CT (dark gray) than on TT (light gray) (P < 0.05); SBP: Systolic Blood Pressure; DBP: Diastolic Blood Pressure. Original studies by Rina Zaslavskaya on blood pressure chronotherapy compared with conventional treatment, eventually transferred from group studies with treatment at a fixed time in relation to the blood pressure acrophase, to individualized treatment optimized in the given patient with control by the monitored blood pressure analyzed as-one-goes by parameter tests and cumulative sums [80].
Figure 18
Figure 18
From homeostasis to clocks and chronomes. †Inferential statistical methods map chronomes as molecular biology maps genomes; biologic chronomes await resolution of their interactions in us and around us, e.g., with magnetic storms in the interplanetary magnetic field (IMF). The alignment of spectra – data transpositions from the time into the frequency domain of data series recorded on us and around us – has just begun and requires lifetime monitoring for critical variables that may provide the reference values for preventive health and environmental care. Homeostasis recognizes that physiological processes remain largely within relatively narrow (but hardly negligible) ranges in health and that departure from such normal ranges is associated with overt disease and still serves that purpose. But it can be improved upon in replacing time-unqualified ranges by time-varying reference limits as prediction and tolerance intervals (chronodesms). Most important, however, is that variability within the normal range is not dealt with as if it were random. The body strives for structured variation, not for "constancy". Learning about the rules of trends and further about rhythmic and chaotic variations that take place within the "usual value ranges" is not needed for the postulation of a "biological clock" that would enable the body to keep track of time. Not surprisingly, this restriction in the scope of chronobiology is most welcome to all of those who still wish no more than their normal ranges and usually only time-unspecified "baselines". The fact that single cells and bacteria are genetically coded for a spectrum of rhythmic variation indicates, however, that the concept of "clock" needs extension beyond the year as a calendar and beyond the beating trans-year, [8,171] and today beyond the recording in the experimental laboratory of lighting, temperature and feeding, among other obvious conditions. Magnetic storms must not be ignored [310-312]. There is a further need to extend focus beyond circadians. When the giant alga Acetabularia, a prominent model for scholars interested in the mechanism of a "clock", is placed into continuous light, after some days in light and darkness alternating every 12 hours (!), the spectrum of changes in its electrical potential reveals the largest amplitude for a component of about (no precisely!) 1 week rather than for one of about 24 hours. An Acetabularia population also shows a circadecadal rhythm [313]. The concept of a broad chronome takes the view that changes occurring within the usual value range resolvable as chronomes, with a predictable multifrequency rhythmic element, allow us to measure the essence of the dynamics of everyday life, and are essential to obtain warnings before the fait accompli of disease, Fig. 16 so that prophylactic measures can be instituted in a timely way.
Figure 19
Figure 19
Endogenous time structure (chronome) of internally coordinated free-running rhythms (top) through feedsidewards in network of spontaneous (α), reactive (β) and modulatory (γ, δ) rhythms (bottom). Circadian desynchronization after blinding, seen time-macroscopically in IA, is also shown time-microscopically as a chronobiologic serial section in IB, as a summary of individual periodograms in IC, and as time relations among three variables at 24-h synchronized (top) or free-running (bottom) frequencies in mice (left) and a human (right) in ID. Section II shows a spontaneous rhythm in corticosterone (α), in antiphase with a reactive rhythm (β). The components of the chronome are internally coordinated through feedsidewards in a network of spontaneous (α), reactive (β) and modulatory (γ, δ) rhythms. For the case of circadians in experimental animal models (section I), some degree of endogenicity of a desynchronized rhythm was demonstrated, statistically validated and quantified by objective numerical characteristics given with their uncertainty. The role of the eyes as a transducer of the effect of the lighting regimen on the circadian variation emerged from studies in the blinded C mouse and the ZRD mouse born anophthalmic [48]. The slight but statistically significant deviation of the period from precisely 24 hours led to the concept of free-running, as an indirect test of some degree of endogenicity. The work started on eosinophil counts, Figs. 1,2,3,4,5,6,7,8,9,10,11, was complemented by measurements of rectal temperature which was more readily measured longitudinally for the lifespan of several generations of mice. Rhythms being a fundamental feature of life, found at all levels of organization, their coordinating role was also studied. Apart from the spontaneous rhythms characterizing variables such as serum corticosterone or melatonin (IIB), reactive rhythms are found in response to a given stimulus applied under standardized controlled conditions of a laboratory in vivo (α in IIA) or in vitro (β in IIA and IIC-E). A third entity such as melatonin may modulate, in a predictable insofar as rhythmic fashion, the effect of one entity upon the second, such as that of the pituitary upon the adrenal or may act directly upon the adrenal. Reproducible sequences of attenuation, no-effect, and amplification, the time-qualified feedsidewards, replacing time-unqualified feedbacks and feedforwards, can then be found (IIC to E).
Figure 20
Figure 20
Terminology. "Circa" in "Circadian"."Diurnal" and "circadian" need not be used by us as synonyms. In our case, "diurnal" relates to the photofraction, and "circadian" means a cycle with a period of about 24 hours. Reasons for the use of "circa" in "circa-rhythms" include among several other considerations, inferential statistical uncertainties that qualify the estimate of period (top left), apart from a desynchronization (top right).
Figure 21
Figure 21
Terminology follows usage in physics. The broader division of biosphere spectra into 3 domains uses the circadian range of 1 cycle in 20–28 hours as a reference for frequencies (not periods!) higher (ultra) or lower (infra) than circadian, in keeping with precedents of nomenclature in physics.
Figure 22
Figure 22
Partial acrophase chart of the circadian system in the mouse illustrates a sequence of physiological tasks among more than 50 variables mapped herein.
Figure 23
Figure 23
Partial acrophase chart reveals a relative synchronization of several aspects of human physiological and psychological performance.
Figure 24
Figure 24
Cyclic adrenocortical activation in humans. The cyclic adrenocortical activation in humans, shown by a decrease in counts of circulating blood eosinophil cells occurring before awakening (endogenous eosinopenia), leads in phase the increase along the 24-hour scale in the excretion of breakdown products of steroidal hormones (17-ketosteroids) following awakening. The adrenal activation as an event in the sleep stage of a circadian system may be compared as a critical event to ovulation in the ovarian cycle. Ovulation prepares for the start of an entire new life; adrenal activation teleonomically prepares for a new day in life [46,88].
Figure 25
Figure 25
Circadian and circaseptan variation in preterm baby's blood pH. As compared to babies at term, prematures routinely monitored longitudinally have provided conclusive data; infradian, notably ~7-day (circaseptan) components in the circulation have an amplitude often larger than the circadians, as illustrated in this figure for blood pH of a very premature boy, JK, born in the 27th gestational week (who was monitored in the hospital for the first 26 months of his extrauterine life) [175]. Values for blood pH during the first five weeks are shown as quadrangles. Two curves are fitted to these data. The lighter curve, representing a model including a 28- and a 178-hour component, fits the data numerically better than the continuous curve corresponding to a model consisting of a precise 1-day and a 7-day component, a finding in keeping with the assumption of built-in free-running circadian and circaseptan rhythms. In this graph, the circadian is represented by the smaller ripples superimposed on the (nearly five) near-weekly cycles of much larger amplitude recurring with a period slightly longer than 7 days. But with either curve-fit, the greater prominence of the circaseptan vs. the circadian amplitude is readily seen. The circaseptan can predominate over the circadian, in humans for the first few weeks of extrauterine life, in a boy born at term, as shown in Figs. 26,27,28,29,30,31, with gliding spectral windows, each presented in two views, to introduce a new fact for circadian scholars and a method applicable further with emphasis also primarily on the circadian and ultradian spectral domains in Fig. 33. Also shown elsewhere [175] are least-squares spectra of 5 consecutive spans, each of about 4 months, showing changes in the development of a spectrum of rhythms. In the first 120 days of very preterm extrauterine life, the peaks corresponding to frequencies lower than 1 cycle/28 hours (infradians) predominate over any circadians, i.e., components with 1 cycle in 20–28 hours also shown elsewhere [175]. The circadian and circasemidian components are expressed by the time of birth, but are free-running and unstable, with a very low amplitude, as compared to circaseptan, circatrigintan (about 30-day) and other infradian components [175].
Figure 26
Figure 26
Changing amplitude of some components in a partial spectral element of the postnatal human systolic blood pressure chronome. Data from a healthy boy, born 19.10.1992, whose blood pressure was measured at mostly 30-minute intervals from 20.10 for the ensuing 40 days, and analyzed as a moving spectrum in separate weekly intervals, displaced in 12-hour increments through the data set. An initially greater prominence of infradians (see ~1 week c, left), shown by height and darker shading, corresponding to a larger amplitude, contrasts with the prominence of circadians and circasemidians in later weeks of life, while any ultradians with still higher frequencies and any trends and chaos, two other chronome elements, are here unassessed. Side view of a gliding spectral window of amplitudes of systolic blood pressure, focusing on infradians and circadians in the first 40 days of life of a boy born at term (FW). The prominence of the infradian spectral components immediately after birth is apparent from shading, height and arrows. In this side view, better than in a view from the top (Figs. 27, 29 and 31), a general impression is best gained of the time course of a gradual resurgence of a circadian component. The circadian is demonstrable on the day of birth as a group phenomenon (not shown herein). The circadian seems to be lost in this graph and the following graphs in Figs. 27,28,29,30,31,32 with the interval of one week used for analysis. Original data of Yoshihiko Watanabe.
Figure 27
Figure 27
Changing amplitude of some components in a partial spectral element of the postnatal human systolic blood pressure chronome. Data from a healthy boy, born 19.10.1992, whose blood pressure was measured at mostly 30-minute intervals from 20.10 for the ensuing 40 days, and analyzed as a moving spectrum in separate weekly intervals, displaced in 12-hour increments through the data set. An initially greater prominence of infradians, shown by darker shading, corresponding to a larger amplitude, contrasts with the prominence of circadians and circasemidians in later weeks of life, while any ultradians with still higher frequencies and any trends and chaos, two other chronome elements, are here unassessed. View from the top, surface chart (or contour map) of a gliding spectral window of amplitudes of systolic blood pressure, focusing on infradians and circadians in the first 40 days of life of a boy born at term (FW). The prominence of the infradian spectral components immediately after birth is apparent from shading [165,166]. The change in shading observed around November 5 is an artefact related to a gap in the data collection. Original data of Yoshihiko Watanabe.
Figure 28
Figure 28
Changing amplitude of some components in a partial spectral element of the postnatal human diastolic blood pressure chronome. Data from a healthy boy, born 19.10.1992, whose blood pressure was measured at mostly 30-minute intervals from 20.10 for the ensuing 40 days, and analyzed as a moving spectrum in separate weekly intervals, displaced in 12-hour increments through the data set. An initially greater prominence of infradians (see ~1 week c, left), shown by height and shading, corresponding to a larger amplitude, contrasts with the prominence of circadians and circasemidians in later weeks of life, while any ultradians with still higher frequencies and any trends and chaos, two other chronome elements, are here unassessed. Gliding spectral window of amplitudes of diastolic blood pressure, focusing on infradians and circadians (side view) in the first 40 days of life of a boy born at term (FW). The prominence of the infradian spectral components immediately after birth is apparent from shading, height and arrows [165,166]. Original data of Yoshihiko Watanabe.
Figure 29
Figure 29
Changing amplitude of some components in a partial spectral element of the postnatal human diastolic blood pressure chronome. Data from a healthy boy, born 19.10.1992, whose blood pressure was measured at mostly 30-minute intervals from 20.10 for the ensuing 40 days, and analyzed as a moving spectrum in separate weekly intervals, displaced in 12-hour increments through the data set. An initially greater prominence of infradians, shown by darker shading, corresponding to a larger amplitude, contrasts with the prominence of circadians and circasemidians in later weeks of life, while any ultradians with still higher frequencies and any trends and chaos, two other chronome elements, are here unassessed. Gliding spectral window of amplitudes of diastolic blood pressure, focusing on infradians and circadians (view from the top; surface chart) in the first 40 days of life of a boy born at term (FW). Prominence of the infradian spectral components immediately after birth is apparent from shading [165,166]. The change in shading observed around November 5 is an artefact related to a gap in the data collection. Original data of Yoshihiko Watanabe.
Figure 30
Figure 30
Changing amplitude of some components in a partial spectral element of the postnatal human heart rate chronome. Data from a healthy boy, born 19.10.1992, whose heart rate was measured at mostly 30-minute intervals from 20.10 for the ensuing 40 days, and analyzed as a moving spectrum in separate weekly intervals, displaced in 12-hour increments through the data set. An initially greater prominence of infradians (see ~1 week c, left), shown by height and shading, corresponding to a larger amplitude, contrasts with the prominence of circadians and circasemidians in later weeks of life, while any ultradians with still higher frequencies and any trends and chaos, two other chronome elements, are here unassessed. Gliding spectral window of amplitudes of heart rate, focusing on infradians and circadians (side view) in the first 40 days of life of a boy born at term (FW). Prominence of infradian spectral components immediately after birth is apparent from shading, height and arrows [165,166]. Original data of Yoshihiko Watanabe.
Figure 31
Figure 31
Changing amplitude of some components in a partial spectral element of the postnatal human heart rate chronome. Data from a healthy boy, born 19.10.1992, whose heart rate was measured at mostly 30-minute intervals from 20.10 for the ensuing 40 days, and analyzed as a gliding special window in separate weekly intervals, displaced in 12-hour increments through the data set. An initially greater prominence of infradians, shown by darker shading, corresponding to a larger amplitude, contrasts with the prominence of circadians and circasemidians in later weeks of life, while any ultradians with still higher frequencies and any trends and chaos, two other chronome elements, are here unassessed. Gliding spectral window of amplitudes of heart rate, focusing on infradians and circadians (view from the top; surface chart) in the first 40 days of life of a boy born at term (FW). The prominence of the infradian spectral components immediately after birth is apparent from shading [165,166]. The change in shading observed around November 5 is an artefact related to a gap in the data collection. Original data of Yoshihiko Watanabe.
Figure 32
Figure 32
Infradian over circadian prominence of blood pressure and heart rate in early extrauterine life. Comparison of amplitudes of circadian (left), circasemiseptan (middle) and circaseptan (right) components of systolic blood pressure (top), diastolic blood pressure (middle) and heart rate (bottom) of groups of babies studied during the first few weeks of life in Brno, Czech Republic. Infradians are more prominent than circadians. Original data from Brno of Jarmila Siegelova [167], in keeping with data from Florence [164], Minneapolis, Moscow and elsewhere [168,15].
Figure 33
Figure 33
Gliding amplitude (A) in spectral window (I, II) shows relative prominence of spectral components, mostly intermittent CHAT, with occasional ultradian prominence. I – Amplitudogram, showing 24-h and 12-h amplitudes (solid lines) and upper limit for 24-h amplitude (dotted horizontal line). II – Gliding window of the time series (interval 28 h, increment 8 h, harmonic increment 0.1); shading of A values begins at P-value ≤ 0.05. III – Global spectral window of time series. CHAT: Circadian Hyper-Amplitude-Tension (upper 4 shadings of A from 24-h fit). **Sundays. During a 2-month section of a 5-year record of half-hourly automatically recorded blood pressures, the circadian rhythm in a human adult male is most prominent (as seen only toward the end of the first month of life in data of healthy neonates born at term or prematurely, Figs. 25,26,27,28,29,30,31,32[164].
Figure 34
Figure 34
Circadian rhythm alteration rather than obliteration after lesioning of suprachiasmatic nuclei (SCN). By eyeballing alone of Section IIA, the circadian rhythm in telemetered core temperature, each measurement shown by a dot, is clearly seen in data from a sham-operated control on the left and seems to be lost in the rat with a SCN lesion on the right of this section, whether one examines squeezed values in the top row or stretched values in the second row (of dots). A circadian rhythm in temperature for individual animals is also displayed in Section I top, with a smaller within-day change of lesioned animals (IB) as compared to controls (IA). This finding is also seen after averaging in Section IIB (bottom). Microscopy, in section IIC, apart from quantifying the rhythm by cosinor, reveals, by a shorter arrow, a great amplitude lowering after a bilateral SCN ablation and a phase advancement seen as an earlier vector. Section IIC also validates the persisting rhythm by the non-overlap of the center (or pole) of the graph, by the error ellipse representing a 95% confidence region: the removal of the SCN is compatible with the persistence of a statistically highly significant circadian rhythm in core temperature quantified with its parameters and their uncertainties, after histologically validated bilateral SCN ablation. When the ablation unintentionally, as discovered at post-mortem, was unilateral (U), the circadian amplitude was enhanced (Section I, bottom), a finding suggesting a subtractive coupling between the two SCN. Section III is in keeping with the speculation of an effect by lunar factors upon the "free-running" (or rather lunar?) period of about 24.8 hours found in controls or unilaterally ablated animals at that light intensity. If this should be in part a lunar effect, it is lost in animals subjected to bilateral (B) suprachiasmatic lesions and apparently tightened by unilateral (U) lesions, a possibility requiring further experimental scrutiny.
Figure 35
Figure 35
Persistent, albeit altered, circadian rhythmicity of 3H-TdR incorporation into DNA of different organs and of mitotic index of corneal epithelium of BD2F1 female mice after bilateral lesioning of suprachiasmatic nuclei (SCN) (rows 1–3); persistence of altered rhythm seen in ethanol (row 4; left) but not water (row 4; right) consumption after bilateral lesioning. Data from JN Pasley (Advances in Chronobiology. JE Pauly and LE Scheving, eds. Alan R Liss, Inc. New York, Part B, pp 467–471, 1987). The SCN coordinates a collateral hierarchy that can be quantified in terms of amplitude and phase: the major effect of bilateral SCN ablation is thus far invariably, comparably to the behavior of core temperature in Fig. 34, an advance in phase for the SCN-lesioned (L) animals in 8 cases out of 8, with a reduction in amplitude, except for DNA labelling in the stomach and colon, which may respond to food directly rather than by the SCN, Section III. Section VI shows a microscopic phase and amplitude chart summarizing the finding in the other sections (I-V, VII and VIII). This chart extends the scope of the lesson learned in Fig. 34 to a number of variables other than core temperature, studied as marker rhythm: rather than being a master clock leading to the loss of all rhythms when ablated bilaterally, the SCN is compatible with the rhythm's persistence in several of the variables investigated, except for water-drinking blood pressure and locomotor activity [201]. A subjective time-macroscopic interpretation-based impression, that led to the master clock illusion is replaced by the objective quantification of a mechanism for period, phase and amplitude in a network [15].
Figure 36
Figure 36
Circadian rhythm of plasma endothelin in clinical health. Data expressed as a percentage of each data series mean; analysis on original data (in pmol/ml) yields P=0.010; MESOR ± SE = 2.68 ± 0.11; A (95% CI) =0.23 (0.06; 0.54). Demonstration of circadian rhythm in endothelin-1 for the first 10 subjects investigated [286] in keeping with earlier work [286] but not with a follow-up [287-289].
Figure 37
Figure 37
Coexisting 8-hour and 24-hour patterns in the same circulation. Circaoctohoran endothelin-1 (ET-1) versus circadian cortisol in 7 clinically healthy students. 2 women and 7 men, 22–27 years of age; note that 8-hour component (c) is most significant for ET-1 (P < 0.001) but it is not detected for cortisol (P > 0.4). Only an about 8-hour (circaoctohoran) group rhythm and no circadian variation characterizes the variability of circulating endothelin-1 in clinically healthy medical students in the presence of a circadian rhythm in circulating cortisol [289].
Figure 38
Figure 38
Ultradians, including an about-8-hourly component, and a prominent about-half-weekly wobbly band characterize the population density of endotheliocytes. Endotheliocytes in pinnal connective tissue – revealed by gliding spectral window periodogram as a contour map with consecutive 7-day intervals, displaced in 0.5-hour increments through a 10-day span of 3-hourly counts, made on presumably undisturbed C57B1 mice, before application of a trauma. Extension of circaoctohoran and 3.5-day (circasemiseptan) components in the endothelin-1 spectrum of the human circulation to the population density of murine endotheliocytes, the cells producing endothelin-1 (but not to the population density of other cells in the same ear pinna, not shown) [290].
Figure 39
Figure 39
Harm or help: With or without chronobiologic patterning, the same total dose per week of Lentinan inhibits or enhances malignant growth, respectively, as compared to saline-treated controls. Key: treatment during active (A) or rest (R) span with sinusoidal weekly pattern (S) or equal daily doses (E) (P < 0.01). Difference in size corresponds to 50% difference in survival time; N = number of animals. Therapeutic optimization by timing drug administration according to biologic week and day. Timing treatment (with a sinusoidally changing vs. a fixed daily dose schedule with the same total dose per week) according to the biological week and preferably by the broader chronome can contribute to the difference between the inhibition or stimulation of a subsequently implanted malignant growth [186].
Figure 40
Figure 40
Larger about-weekly than about-daily cycle in electrical potential of a unicellular alga (Acetabularia Acetabulum evolved 500 million years ago). Nonlinear spectral analysis on signal averaged data from 20 single cells, released (zero time) into continuous light (LL), after prior standardization in light and darkness alternating at 12-hour intervals (LD12:12) for up to one week. Total number of observations: 38,578; experimental span: 376 days. Note a more prominent amplitude (A) for a component with a period near a week thanks the As of the about daily and about half-weekly components (all free-running). The circaseptan A is equated to 100 and the other As are expressed as percentage of the circaseptan. Meta-analyzed data of Dr Sigrid Berger, Dr Lübbo von Lindern and the late Dr Hans-Georg Schweiger. The about-7-day (circaseptan) component is more prominent than the circadian rhythm in the electrical potential of a eukaryotic unicell released into continuous light after prior exposure to a light-dark schedule alternating at 12-hour intervals [187]. Models such as Acetabularia may help to better understand circaseptan and circadecadal components (both demonstrated for Acetabularia) and still broader chronome organization. Along with even older cyanobacteria that also show circaseptans [15], Acetabularia may serve to explore the origins of life, another topic of inquiry into the chronomes of our evolution and even into the chronomes of our cosmoi in the broadest sense for which organisms can serve as transdisciplinary radiation detectors. Acetabularia [292], like air bacteria and staphylococci [293], also serves as a laboratory model for circadecadal rhythms.
Figure 41
Figure 41
Measurable time structure (chronome) of a variable. The chronome (derived from chronos, time, and nomos, rule) represents quantitatively the measurable time structure of any variable, biological or environmental. In biology only, the ending "-ome" can also stand for "chromosome", to convey the genetic basis of (habitat- and broader cosmos-influenced) multifrequency rhythms, which are the major elements of chronomes, along with developmental and other age trends, and chaos, all interacting as feedsidewards among different frequencies in us and in our environment.
Figure 42
Figure 42
Emergenic heritability of the circadian amplitude of human heart rate. Assessed by statistically significant intra-class correlation (rI) for monozygotic (MZ) but not for dizygotic (DZ) twin pairs reared apart. Heart rate was assessed in 24-hour electrocardiograms, amplitude was computed by cosinor; a statistically significant intra-class correlation (r1) for monozygotic (MZ) but not for dizygotic (DZ) twin pairs reared apart was found [85,304].
Figure 43
Figure 43
Spectral window of systolic blood pressure showing biggest amplitude (arrow) near period of Richardson's variation in solar wind speed. Data of 72-year old man at the start of the 5-year record of mostly 30-minute automatic "ambulatory" measurements with an A&D monitor (except for an about 2-month break). Uncertainty regions serve only for ordering. A trans-year is prominent and can be resolved in addition to an about-yearly component in human blood pressure [8,171], as anticipated from the role of biospheric-environmental spectral reciprocity [56]. The presence of a trans-year was confirmed in each of the available human blood pressure and heart rate series covering over 5 (up to 36) years.
Figure 44
Figure 44
Closer agreement of about 1.3-year component in human blood pressure (BP) and heart rate (HR) with long-term than with concurrent solar wind (SW) speed. The non-overlapping 95% confidence intervals have to be qualified by the very wobbly nature of the Richardson component in SW and physiology. The 95% confidence intervals of a transannual spectral component in a subject's blood pressure and heart rate do not overlap that of the solar wind during the same time span: putative evidence in keeping with the assumption of some degree of endogenicity for a signature of a non-photic environmental cycle in the biosphere.
Figure 45
Figure 45
Meal-timing and body weight: relative body weight loss for individuals consuming single daily meal (free-choice or fixed) as breakfast (B) or dinner (D). Difference in body weight change on breakfast-only vs. dinner-only, when clinically healthy subjects consumed a fixed number of calories within 1 hour of getting up vs. not before 12 hours after getting up, respectively [2]. In two separate studies of the effect of meal timing on body weight, nine men and nine women consumed either, for 1 week, a fixed 2,000-kcal meal, or, for 3 weeks, a single free-choice meal as breakfast (B) or dinner (D). A relative body weight loss of about 1 kg/wk was noted on breakfast-only, as seen from a comparison of the hatched horizontal bands.
Figure 46
Figure 46
"Appetite" modifies effect of meal-timing on body weight. Relative body weight loss on breakfast-only (B) as compared to dinner-only (D) is less when meal is free-choice rather than fixed. *Here defined as choice of kind and amount of food. †Weight change (kg/week) on B subtracted from that on D. Appetite (here defined as choice and amount of food) modifies effect of meal timing on body weight. Relative body weight loss on breakfast-only (B) vs. dinner-only (D) is less when meal is free choice rather than fixed (see Fig. 45 for results on individuals) [2].
Figure 47
Figure 47
Effect of sodium intake on blood pressure. Blood pressure change in association with change in sodium intake is an individual's concern and cannot be generalized. The recommendation of reducing dietary sodium intake across the board to prevent blood pressure elevation is unwarranted, as shown in two different studies. Routine self-testing by each individual could avoid much controversial debate in the literature.
Figure 48
Figure 48
Shall we pass the salt? or pass, on the salt? Responses to a low-salt (low-sodium) diet differ: blood pressure may be lowered, may remain unchanged by reducing dietary salt, or may actually be raised when salt is restricted. Self-responsibility by the given individual in terms of manipulating sodium intake with surveillance of one's blood pressure seems to be the most suitable solution to determine the best course of action (see Fig. 47).
Figure 49
Figure 49
The concept of chronomics.

References

    1. Refinetti R. Circadian Physiology. Boca Raton, Fl: CRC Press. 1999.
    1. Halberg F, Haus E, Cornélissen G. From biologic rhythms to chronomes relevant for nutrition. In: Marriott BM, editor. Not Eating Enough: Overcoming Underconsumption of Military Operational Rations. Washington DC: National Academy Press; 1995. pp. 361–372. - PubMed
    1. Halberg F, Cornélissen G, Otsuka K, Schwartzkopff O, Halberg J, Bakken EE. Chronomics. Biomedicine and Pharmacotherapy. 2001;55:153–190. - PubMed
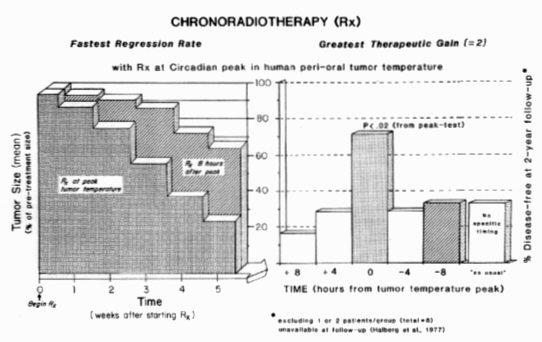
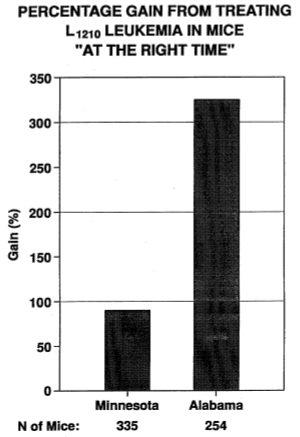
    1. Halberg F. When to treat. Hæmatologica (Pavia) 1975;60:1–30. - PubMed
    1. Halberg F. When to treat. Indian J Cancer. 1975;12:1–20. - PubMed

LinkOut - more resources