

Assessment of the reproducibility of postprocessing dynamic CT perfusion data
- PMID: 14729537
- PMCID: PMC7974174
Assessment of the reproducibility of postprocessing dynamic CT perfusion data
Abstract
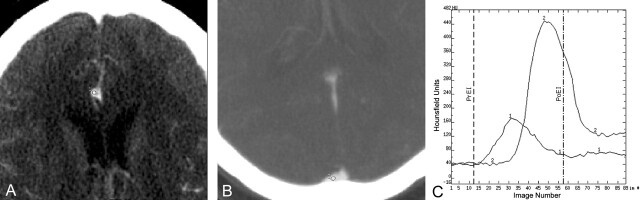
Background and purpose: Commercially available software programs for the conversion of dynamic CT perfusion (CTP) source data into cerebral blood volume (CBV), cerebral blood flow (CBF), and mean transit time (MTT) maps require operators to subjectively define parameters that are used in subsequent postprocessing calculations. Our purpose was to define the variability of CBV, CBF, and MTT values derived from CTP maps generated from the same source data postprocessed by three different CT technologists (CTTs).
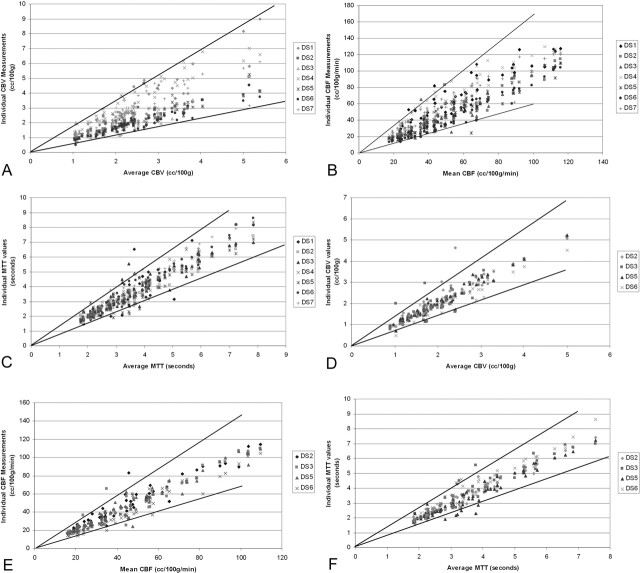
Methods: Raw data derived from dynamic CTP examinations performed in 20 subjects were postprocessed seven times by three experienced CTTs. Parenchymal regions of interest derived from each map (CBV, CBF, and MTT) were compared. The CBF maps generated by each technologist were also qualitatively assessed. Decisions made by each analyzer during postprocessing were assessed.
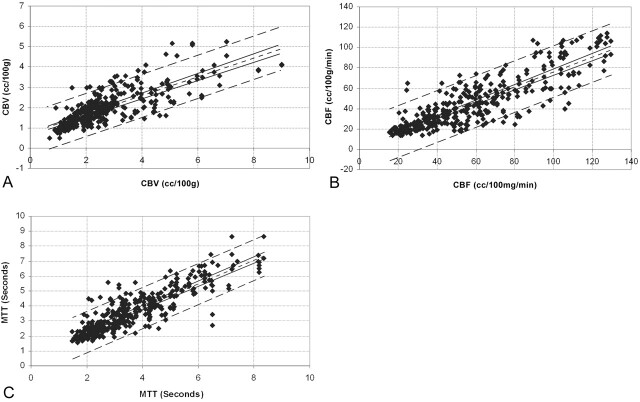
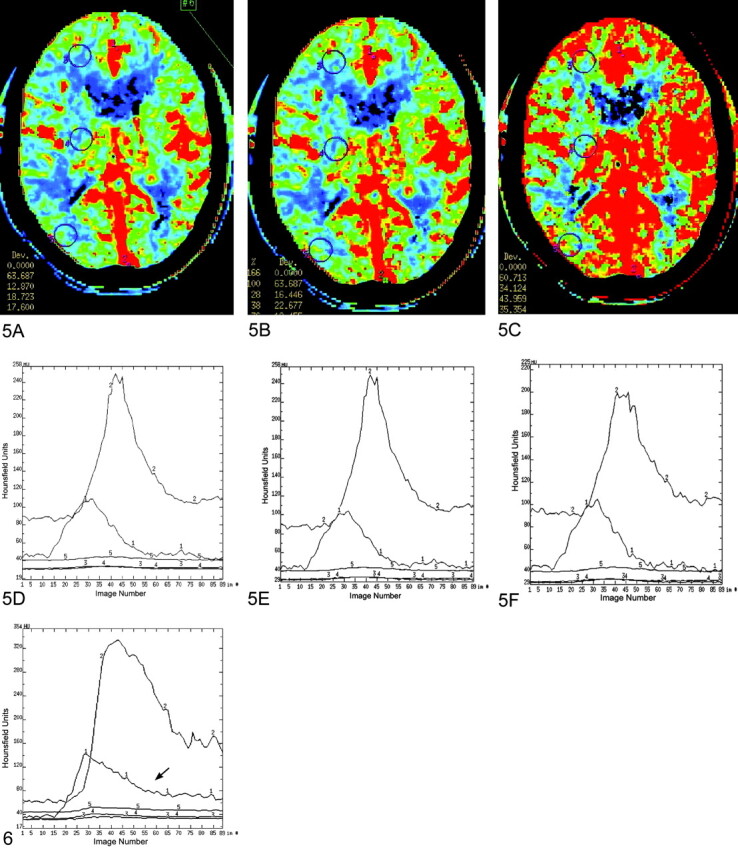
Results: The intraclass correlation coefficients were 0.73 (95% CI, 0.64-0.81), 0.87 (0.83-0.91) and 0.89 (0.85-0.93), for the CBV, CBF, and MTT parenchymal regions of interest, respectively. All individual correlation coefficients between data sets were significant to a P value <.05. Measurement error, made solely on the basis of different technologists postprocessing the same source data and expressed as the coefficients of variation, were 31%, 30%, and 14% for CBV, CBF, and MTT, respectively. The selection of the arterial input function (AIF) region of interest, venous function region of interest, and preenhancement interval were very reproducible. The technologists differed significantly with respect to the selection of the postenhancement image (PoEI) (P <.01). A retrospective review of the individual CBF maps indicated that variance in the PoEI selection accounted for much of the variation in the qualitative appearance of the CBF maps generated by different technologists. The PoEI was selected to demarcate the baseline of the AIF time-attenuation curve. It is likely that this method of PoEI selection significantly contributed to intra- and interanalyzer variability.
Conclusion: There is a high degree of correlation between parenchymal regions of interest derived from CBV, CBF, and MTT maps generated from the same dynamic CTP source data postprocessed by different operators. The level of agreement, however, may not be sufficient to incorporate quantitative values into clinical decision making. Quantitative differences between parenchymal regions of interest were not infrequently manifest as significant differences in the qualitative appearance of the CBF maps. It is likely that, with optimization of postprocessing parameter selection, the degree of variability may be substantially reduced.
Figures

Comment in
-
Is CT perfusion ready for prime time?AJNR Am J Neuroradiol. 2004 Jan;25(1):3-4. AJNR Am J Neuroradiol. 2004. PMID: 14729518 Free PMC article. No abstract available.
Similar articles
-
Reproducibility of postprocessing of quantitative CT perfusion maps.AJR Am J Roentgenol. 2007 Jan;188(1):213-8. doi: 10.2214/ajr.05.2188. AJR Am J Roentgenol. 2007. PMID: 17179367
-
The effect of varying user-selected input parameters on quantitative values in CT perfusion maps.Acad Radiol. 2004 Oct;11(10):1085-92. doi: 10.1016/j.acra.2004.07.002. Acad Radiol. 2004. PMID: 15530801
-
Automated versus manual post-processing of perfusion-CT data in patients with acute cerebral ischemia: influence on interobserver variability.Neuroradiology. 2009 Jul;51(7):445-51. doi: 10.1007/s00234-009-0516-9. Epub 2009 Mar 10. Neuroradiology. 2009. PMID: 19274457 Free PMC article.
-
Cerebral perfusion CT: technique and clinical applications.Radiology. 2004 Jun;231(3):632-44. doi: 10.1148/radiol.2313021488. Epub 2004 Apr 29. Radiology. 2004. PMID: 15118110 Review.
-
Brain perfusion CT: principles, technique and clinical applications.Radiol Med. 2007 Dec;112(8):1225-43. doi: 10.1007/s11547-007-0219-4. Epub 2007 Dec 13. Radiol Med. 2007. PMID: 18074193 Review. English, Italian.
Cited by
-
Imaging Biomarkers for Intra-arterial Stroke Therapy.Cardiovasc Eng Technol. 2013 Dec 1;4(4):339-351. doi: 10.1007/s13239-013-0148-4. Cardiovasc Eng Technol. 2013. PMID: 24932316 Free PMC article.
-
Interleaving cerebral CT perfusion with neck CT angiography part I. Proof of concept and accuracy of cerebral perfusion values.Eur Radiol. 2017 Jun;27(6):2649-2656. doi: 10.1007/s00330-016-4577-y. Epub 2016 Oct 7. Eur Radiol. 2017. PMID: 27718078 Free PMC article.
-
Standardization of Stroke Perfusion CT for Reperfusion Therapy.Transl Stroke Res. 2012 Jun;3(2):221-7. doi: 10.1007/s12975-012-0156-y. Epub 2012 Mar 28. Transl Stroke Res. 2012. PMID: 24323777
-
Short- and long-term hemodynamic and clinical effects of carotid artery stenting.AJNR Am J Neuroradiol. 2012 Jun;33(6):1170-6. doi: 10.3174/ajnr.A2930. Epub 2012 Jan 19. AJNR Am J Neuroradiol. 2012. PMID: 22268082 Free PMC article. Clinical Trial.
-
Computed Tomography (CT) Perfusion in Abdominal Cancer: Technical Aspects.Diagnostics (Basel). 2013 Apr 3;3(2):261-70. doi: 10.3390/diagnostics3020261. Diagnostics (Basel). 2013. PMID: 26835679 Free PMC article.
References
-
- Cenic A, Nabavi DG, Craen RA, et al. Dynamic CT measurement of cerebral blood flow: a validation study. AJNR Am J Neuroradiol 1999;20:63–73 - PubMed
-
- Nabavi DG, Cenic A, Craen RA, et al. CT assessment of cerebral perfusion: experimental validation and initial clinical experience. Radiology 1999;213:141–149 - PubMed
-
- Powers WJ, Grubb RL, Darriet D, Raichle ME. Cerebral blood flow and cerebral metabolic rate of oxygen requirements for cerebral function and viability in humans. J Cereb Blood Flow Metab 1985;5:600–608 - PubMed
-
- Walker MT, Deshmukh S, Harbison DL, Partovi S. CT perfusion imaging. BNI Quarterly 2001;17:15–27
-
- Eastwood JD, Lev MH, Provenzale JM. Perfusion CT with iodinated contrast material. Am J Radiol 2003;180:3–15 - PubMed
Publication types
MeSH terms
LinkOut - more resources
Full Text Sources
Medical