. 2004 Feb;16(2):478-99.
doi: 10.1105/tpc.017814. Epub 2004 Jan 16.

In-depth analysis of the thylakoid membrane proteome of Arabidopsis thaliana chloroplasts: new proteins, new functions, and a plastid proteome database

Affiliations

In-depth analysis of the thylakoid membrane proteome of Arabidopsis thaliana chloroplasts: new proteins, new functions, and a plastid proteome database

Giulia Friso et al. Plant Cell. 2004 Feb.

Abstract

An extensive analysis of the Arabidopsis thaliana peripheral and integral thylakoid membrane proteome was performed by sequential extractions with salt, detergent, and organic solvents, followed by multidimensional protein separation steps (reverse-phase HPLC and one- and two-dimensional electrophoresis gels), different enzymatic and nonenzymatic protein cleavage techniques, mass spectrometry, and bioinformatics. Altogether, 154 proteins were identified, of which 76 (49%) were alpha-helical integral membrane proteins. Twenty-seven new proteins without known function but with predicted chloroplast transit peptides were identified, of which 17 (63%) are integral membrane proteins. These new proteins, likely important in thylakoid biogenesis, include two rubredoxins, a potential metallochaperone, and a new DnaJ-like protein. The data were integrated with our analysis of the lumenal-enriched proteome. We identified 83 out of 100 known proteins of the thylakoid localized photosynthetic apparatus, including several new paralogues and some 20 proteins involved in protein insertion, assembly, folding, or proteolysis. An additional 16 proteins are involved in translation, demonstrating that the thylakoid membrane surface is an important site for protein synthesis. The high coverage of the photosynthetic apparatus and the identification of known hydrophobic proteins with low expression levels, such as cpSecE, Ohp1, and Ohp2, indicate an excellent dynamic resolution of the analysis. The sequential extraction process proved very helpful to validate transmembrane prediction. Our data also were cross-correlated to chloroplast subproteome analyses by other laboratories. All data are deposited in a new curated plastid proteome database (PPDB) with multiple search functions (http://cbsusrv01.tc.cornell.edu/users/ppdb/). This PPDB will serve as an expandable resource for the plant community.


Figures

Figure 1.
Figure 1.
Overview of the Generation of the Three Thylakoid Subproteomes and Their Protein Separation and Identification by MS. (A) Sequential extraction of thylakoid membrane proteins based on membrane affinity and solubility in organic solvents. Yeda press–treated purified thylakoid membranes were incubated with Na2CO3, and released proteins were collected. Residual peripheral thylakoid proteins in these Na2CO3-stripped thylakoid membranes were extracted by incubation with Triton X-114, followed by two-phase separation. The water-soluble proteins in the upper phase were collected. These two water-soluble proteomes were separated on 2-DE gels, with IPG strips in the first dimension, followed by SDS-PAGE in the second dimension. To analyze the hydrophobic thylakoid proteins, the Na2CO3-stripped thylakoids were solubilized in SDS and sequentially extracted with organic solvents, as explained in (B). The different fractions were separated by RP-HPLC or by SDS-PAGE. (B) Scheme of fractionation and identification of the hydrophobic membrane proteome by sequential organic solvent extraction, followed by 1-DE PAGE or RP-HPLC and identification by MS analysis. Thylakoid membranes were stripped of lumenal and peripheral proteins with chaotropic agents and sonication and dissolved in Laemmli buffer before organic solvent extraction. Membranes first were dissolved in Laemmli solubilization buffer, followed by extraction in 100% acetone to remove the large amount of chlorophylls and carotenoids. These chromophores would otherwise interfere with further analysis. The remaining protein population, mostly devoid of pigments, was further fractionated by extraction with a mixture of C/M in a ratio of 9:1. This resulted in a three-phase separation with one subset of proteins fractionating to the upper, methanol-enriched phase, one set of proteins dissolving in the lower, chloroform-enriched phase, and a fraction of proteins accumulating in the interphase. The interphase was collected and further extracted by a C/M mixture in a ratio of 1:1, which yielded a subset of C/M 1:1 soluble proteins and a C/M 1:1 insoluble pellet (rest). (C) Protein gel blot analysis. Partitioning of the lumenal peripheral protein OEC23 was assessed by protein gel blot analysis. The presence of chloroplast envelopes in the starting material for the proteome analysis in this study was determined by blotting with Toc75, a well-known envelope protein. Lane 1, intact chloroplasts; lane 2, Yeda press–treated thylakoid membranes; lane 3, Na2CO3-stripped, Yeda press–treated thylakoids; lane 4, Na2CO3-extracted thylakoid proteins. Thirty micrograms of chlorophyll was loaded for lanes 1, 2, and 3. Lane 4 contained Na2CO3-extracted proteins from Yeda press–treated thylakoids equivalent to 30 μg of chlorophyll.
Figure 2.
Figure 2.
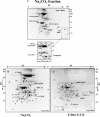
2-DE Gels of the Na2CO3 and Triton X-114–Extracted Thylakoid Proteomes, Stripped by Yeda Press. Data from the gel identifications are summarized in Table 1 and in Table 1 in the supplemental data online. Details of experimental coordinates and MS identification can be found in Tables 2 and 3 in the supplemental data online. (A) Analysis of the Na2CO3-extracted thylakoid proteome stripped of lumenal proteins by three cycles of Yeda press. Sypro Ruby–stained 2-DE gel (pI range 3 to 10 and inset 6 to 11) of peripheral proteins extracted by Na2CO3. (B) and (C) Comparison between the Na2CO3 (B) and Triton X-114 (C)–extracted proteomes and the identified proteins in the pI range of 4 to 6. (B) and (C) Comparison between the Na2CO3 (B) and Triton X-114 (C)–extracted proteomes and the identified proteins in the pI range of 3 to 6. (D) and (E) Close-ups of the region around the OEC33 cluster of gels stained by Sypro Ruby (D) or by silver nitrate (E). The region around this cluster contains a number of fibrillins and they are partially masked by OEC33 and more clearly visible in the Triton X-114 map. Sypro Ruby staining gives superior detection because saturation of staining, as seen in the silver stained maps, is avoided.
Figure 2.
Figure 2.
2-DE Gels of the Na2CO3 and Triton X-114–Extracted Thylakoid Proteomes, Stripped by Yeda Press. Data from the gel identifications are summarized in Table 1 and in Table 1 in the supplemental data online. Details of experimental coordinates and MS identification can be found in Tables 2 and 3 in the supplemental data online. (A) Analysis of the Na2CO3-extracted thylakoid proteome stripped of lumenal proteins by three cycles of Yeda press. Sypro Ruby–stained 2-DE gel (pI range 3 to 10 and inset 6 to 11) of peripheral proteins extracted by Na2CO3. (B) and (C) Comparison between the Na2CO3 (B) and Triton X-114 (C)–extracted proteomes and the identified proteins in the pI range of 4 to 6. (B) and (C) Comparison between the Na2CO3 (B) and Triton X-114 (C)–extracted proteomes and the identified proteins in the pI range of 3 to 6. (D) and (E) Close-ups of the region around the OEC33 cluster of gels stained by Sypro Ruby (D) or by silver nitrate (E). The region around this cluster contains a number of fibrillins and they are partially masked by OEC33 and more clearly visible in the Triton X-114 map. Sypro Ruby staining gives superior detection because saturation of staining, as seen in the silver stained maps, is avoided.
Figure 3.
Figure 3.
Distribution of Identified Proteins Over the Different Fractions. (A) Distribution of the identified proteins over the different fractions identified from 2-DE gels. Overlap of the different protein sets is shown. (B) Stacked bar diagram with the distribution of identified proteins (separated in soluble and TM proteins) over the Yeda press fraction (lumenal enriched), the Na2CO3 fraction, the Triton X-114 fraction, and the eight organic solvent fractions. 1, Lumenal-enriched (Yeda press); 2, Triton X-114; 3, Na2CO3 fraction; 4, acetone; 5, C/M 9:1 lower phase; 6, C/M 9:1 upper phase; 7, C/M 1:1; 8, residual insoluble pellet; 9, C/M 9:1 total; 10, C/M 1:1 RP-HPLC. Membrane proteins are shown in black. (C) Distribution of the identified proteins over the 2-DE gels and organic solvent fractions. Overlap between the proteins identified from the 2-DE gels and organic solvents is shown.
Figure 4.
Figure 4.
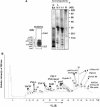
Separation and Identification of the Acetone and C/M-Soluble Thylakoid Proteins. (A) High-resolution gradient 1-DE Tricine-PAGE of the five protein fractions from sequential organic solvent fractionation of Na2CO3-stripped thylakoid membranes. The five fractions are acetone-soluble proteins (panel at left), C/M 9:1 lower phase (9:1 L), C/M 9:1 upper phase (9:1 U), C/M 1:1 soluble proteins (1:1), and the residual insoluble pellet (R). Gels were stained by silver nitrate in the acetone fraction and by Coomassie blue for the other fractions. Proteins identified in the acetone fraction are cytb559β (Atcg00570), psbL (Atcg00560), psbW (At2g30570), psbX (At2g06520), psbZ/ycf9 (Atcg00300), psaI/subunit VIII (Atcg00530), and CFo-III (Atcg00140). (B) Proteins extracted by C/M 1:1 were separated using RP-HPLC, and a representative chromatogram is shown. Fraction number and the percentage of solvent B are indicated. Protein identities of a number of proteins are indicated. The absorbance was monitored at 280 nm (rather than 214 nm) because isopropanol absorbs strongly at 205 nm; thus, the peaks are not quantitative.
Figure 5.
Figure 5.
Identification of Paralogues of the LHCII Family. Alignment and identification of processed LHCII-2.1 (At2g05100), LHCII-2.2 (At2g05070), and LHCII-2.4 (At3g27690) (predicted cTPs were removed). One unique peptide was identified for LHCII-2.2 (boxed in green) and one for LHCII-2.4 (boxed in blue). Many other peptides were identified that matched to all three LHC proteins, some are indicated (boxed in black). Arrows indicate amino acid residues that help to identify the different paralogues.
Figure 6.
Figure 6.
Linking the Physical-Chemical Properties of the Identified Processed (Mature) Proteins to the Sequential Fractionation. Cleavable presequences were removed. (A) Scatter plot of GRAVY index and number of TMs per amino acid for all identified proteins with predicted or identified TMs. (B) Frequency distribution of the GRAVY index for proteins identified in four organic solvent fractions: acetone, C/M 1:9 U+L, C/M 1:1, and the rest fraction. (C) Correlation between protein length (in amino acids) and GRAVY index for those photosynthetic proteins that were identified (open squares) and those that were not identified (closed squares).
Figure 7.
Figure 7.
Functional Classification of the Identified Proteins. (A) Functional classification of all 198 identified proteins. 1, nonchloroplast; 2, translation (ribosomal subunits, RNA binding proteins, and PSRPs); 3, chaperones, protein insertion and assembly, proteases, and protein isomerases; 4, primary and secondary metabolism; 5, thylakoid photosynthetic apparatus (including FNR and PC); 6, alternative electron flow; 7, oxidative stress (Fe-SOD, peroxyredoxins, thioredoxins, ascorbate peroxidase, fibrillins, and Ohp1 and Ohp2); 8, new chloroplast proteins without obvious function; 9, other lumenal proteins without obvious function. (B) Identified proteins of the photosynthetic machinery, as compared with all predicted proteins and grouped with (black) or without (blue) TM, for PSII (including LHCII), PSI (including LHCI), cytochrome b6f complex, and ATP synthase. The striped areas represent the unidentified proteins.

References

    1. Andersson, U., Heddad, M., and Adamska, I. (2003). Light stress-induced one-helix protein of the chlorophyll a/b-binding family associated with photosystem I. Plant Physiol. 132, 811–820. - PMC - PubMed
    1. Arabidopsis Genome Initiative. (2000). Analysis of the genome sequence of the flowering plant Arabidopsis thaliana. Nature 408, 796–815. - PubMed
    1. Aro, E.-M., and Andersson, B. (2001). Regulation of Photosynthesis. (Dordrecht, The Netherlands: Kluwer Academic Publishers).
    1. Bateman, A., Birney, E., Cerruti, L., Durbin, R., Etwiller, L., Eddy, S.R., Griffiths-Jones, S., Howe, K.L., Marshall, M., and Sonnhammer, E.L. (2002). The Pfam protein families database. Nucleic Acids Res. 30, 276–280. - PMC - PubMed
    1. Bell, E., Creelman, R.A., and Mullet, J.E. (1995). A chloroplast lipoxygenase is required for wound-induced jasmonic acid accumulation in Arabidopsis. Proc. Natl. Acad. Sci. USA 92, 8675–8679. - PMC - PubMed

Publication types

MeSH terms

Associated data