. 2004 Feb;24(3):1245-55.
doi: 10.1128/MCB.24.3.1245-1255.2004.

Role for the pleckstrin homology domain-containing protein CKIP-1 in phosphatidylinositol 3-kinase-regulated muscle differentiation

Affiliations

Role for the pleckstrin homology domain-containing protein CKIP-1 in phosphatidylinositol 3-kinase-regulated muscle differentiation

Alexias Safi et al. Mol Cell Biol. 2004 Feb.

Abstract

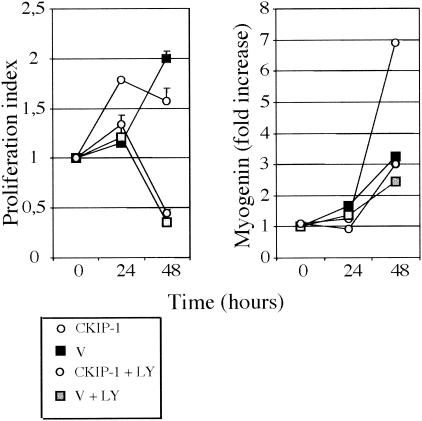
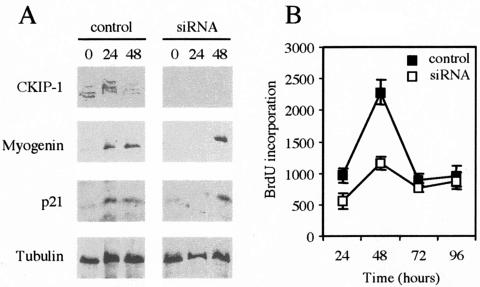
In this work, we report the implication of the pleckstrin homology (PH) domain-containing protein CKIP-1 in phosphatidylinositol 3-kinase (PI3-K)-regulated muscle differentiation. CKIP-1 is upregulated during muscle differentiation in C2C12 cells. We show that CKIP-1 binds to phosphatidylinositol 3-phosphate through its PH domain and localizes to the plasma membrane in a PI3-K-dependent manner. Activation of PI3-K by insulin or expression of an active form of PI3-K p110 induces a rapid translocation of CKIP-1 to the plasma membrane. Conversely, expression of the 3-phosphoinositide phosphatase myotubularin or PI3-K inhibition by LY294002, wortmannin, or mutant p85 abolishes CKIP-1 binding to the membrane. Upon induction of differentiation in low-serum medium, CKIP-1 overexpression in C2C12 myoblasts first promotes proliferation and then stimulates the expression of myogenin and cell fusion in a manner reminiscent of the dual positive effect of insulin-like growth factors on muscle cells. Interference with the PI3-K pathway impedes the effect of CKIP-1 on C2C12 cell differentiation. Finally, silencing of CKIP-1 by RNA interference abolishes proliferation and delays myogenin expression. Altogether, these data strongly implicate CKIP-1 as a new component of PI3-K signaling in muscle differentiation.


Figures

FIG. 1.
FIG. 1.
Expression pattern of CKIP-1 in C2C12 cells (A) Immunoblots for endogenous CKIP-1, myogenin, and p21 obtained with whole-cell extracts of C2C12 myoblasts cultured in GM and DM for up to 5 days. Loading was verified by immunoblotting for beta-tubulin. (B) Immunofluorescence for endogenous CKIP-1 and myogenin in C2C12 myoblasts and myotubes. C2C12 cells were cultured in GM (myoblasts) or in DM for 5 days (myotubes), and CKIP-1 (red) and myogenin (green) were visualized with a rabbit polyclonal anti-CKIP-1 antibody and a mouse monoclonal antimyogenin antibody as primary antibodies. The nuclei were stained with Hoechst reagent 33358. Staining was visualized by confocal microscopy. Bar, 5 μm. (C) Northern blot analysis for CKIP-1 transcripts in C2C12 myoblasts (GM) and myotubes after 5 days in DM (DM 5). Equal loading was verified with ethidium bromide-stained ribosomal 28S and 18S RNAs (EtBr).
FIG. 2.
FIG. 2.
Intracellular localization of CKIP-1 (A) (Top) Schematic presentation of wild-type and mutant CKIP-1 expressed in C2C12 cells. The mutant CKIP-1ΔPH was obtained by deleting the first 146 amino acids of CKIP-1, corresponding to the PH domain. (Bottom) Immunolocalization of wild-type and mutant CKIP-1 proteins in growing C2C12 cells. C2C12 cells were transfected with pcDNA3 CKIP-1 (CKIP-1) or pcDNA3-CKIP-1ΔPH (CKIP-1ΔPH) and cultured in GM for a further 18 h. After fixation, cells were stained with a rabbit anti-CKIP-1 polyclonal antibody and visualized by confocal microscopy. Bar, 5 μm. (B) Distribution of wild-type and mutant CKIP-1 proteins in the nuclear (N), soluble (S100), and particulate (P100) fractions. Fractions were prepared from C2C12 cells expressing wild-type CKIP-1 or CKIP-ΔPH cultured in GM for 18 h following transfection. A 10-μg portion of each fraction was analyzed by immunoblotting using the anti-CKIP-1 polyclonal antibody.
FIG. 3.
FIG. 3.
Comparison between AKT-and CKIP-1ΔPH domains and subcellular localization after insulin stimulation. (A) Sequence comparison of the CKIP-1 PH domain with those of mouse AKT-2 and AKT-1. Conserved residues are shown in blue, and those predicted to bind 3-phosphoinositides with high affinity are shown in red. (B) C2C12 cells were transiently transfected with pcDNA3-CKIP-1 (CKIP-1) or pECE-HA-AKT-1 (AKT-1) or pcDNA3-CKIP-1ΔPH (CKIP-1ΔPH) plasmids. Eighteen hours after transfection, cells were serum starved by incubation in DMEM alone for 4 h (DMEM) and stimulated with insulin (Ins; 25 μg/ml) for 5 and 10 min. After fixation, cells were stained by indirect immunofluorescence using a rabbit anti-CKIP-1 polyclonal antibody and an anti-HA-tag monoclonal antibody to visualize CKIP-1 (red) and AKT-1 (green), respectively, and visualized by confocal microscopy. Arrows indicate membranous CKIP-1 and AKT-1. Bar, 5 μm. (C) C2C12 cells were transiently transfected with pcDNA3-CKIP-1. Eighteen hours after transfection, cells were serum starved by incubation in DMEM alone for 4 h and kept in DMEM alone (−) or stimulated with insulin (25 μg/ml) (+) for 10 min. Total cell extracts (T) and cellular fractions (N, S100, and P100) were then prepared and immunoblotted for CKIP-1.
FIG. 4.
FIG. 4.
CKIP-1 binds specifically to PtdIns-3P. (A) In vitro-translated CKIP-1, CKIP-1ΔPH, and AKT-1 proteins were analyzed by SDS-PAGE and autoradiography (top). One and two microliters of each were loaded on the gel. The ability of these proteins to bind a variety of phosphoinositides was analyzed in a protein-lipid overlay assay (bottom). The same amounts of different proteins were incubated with membranes shown in the lower panels. Dilutions of the indicated phosphoinositides are 100, 50, 25, 12.5, 6.3, 3.2, and 1.6 pmol/spot. (B) (Top) Colocalization of CKIP-1 PH and p40phox PX domains on the endosomes and at the plasma membrane. C2C12 cells were transiently transfected with pcDNA3-CKIP-1 PH and pEGFP-p40phox iPX expression vectors. Eighteen hours after transfection, cells were serum starved by incubation in DMEM alone for 4 h and stimulated with insulin (25 μg/ml) for 10 min. After fixation, C2C12 cells were stained by indirect fluorescence. The CKIP-1 PH domain was detected with the anti-M2-Flag antibody (red). The pEGFP-p40phox PX domain was visualized directly (green). Staining was visualized by confocal microscopy. Magnifications of areas outlined in white show the CKIP-1 PH and p40phox PX domain colocalization on the endosomes and at the plasma membrane. Bar, 5 μm. (Bottom) Insulin-induced CKIP-1 and 2XFYVE probe colocalization at the plasma membrane. C2C12 cells were transiently transfected with pcDNA3-CKIP-1 and pCMV-myc-2XFYVE expression vectors. Eighteen hours after transfection, cells were serum starved by incubation in DMEM alone for 4 h and stimulated with insulin (25 μg/ml) for 10 min. After fixation, cells were stained by indirect immunofluorescence using rabbit anti-CKIP-1 polyclonal and anti-Myc tag monoclonal antibodies to visualize CKIP-1 (red) and 2XFYVE (green), respectively. Staining was visualized by confocal microscopy. Bar, 5 μm. (C) C2C12 cells, transiently transfected with CKIP-1 in combination with pEGFP-wt-MTM1 (CKIP-1+MTM1) or pEGFP-MTM1 C375S (CKIP-1+MTM1C375S), were cultured in GM. Eighteen hours after transfection, cells were fixed and analyzed by indirect immunofluorescence for CKIP-1 (red). EGFP-MTM1 and -MTM1C375S (green) were visualized directly. Immunofluorescence analysis was performed with rabbit anti-CKIP-1 polyclonal antibody. Staining was visualized by confocal microscopy. Bar, 5 μm.
FIG. 5.
FIG. 5.
Interference with the PI3-K pathway modifies CKIP-1 cellular localization. (A) C2C12 cells were transfected with pcDNA3-CKIP-1 alone (CKIP-1) or in combination with the Myc-tagged activated PI3-K p110* (CKIP-1+myc-p110*). Eighteen hours after transfection, cells were serum starved in DMEM alone for 4 h before fixation and immunofluorescence for CKIP-1 (red) with a rabbit anti-CKIP-1 polyclonal antibody and for PI3-K p110* (green) with an anti-c-Myc-tag monoclonal antibody. Staining was visualized by confocal microscopy. Bar, 5 μm. (B) C2C12 cells, transiently transfected with pcDNA3-CKIP-1 alone (CKIP-1) or in combination with pLXSN-Δp85 (CKIP-1 + Δp85), were cultured in GM. CKIP-1 transfected cells were also treated with LY294002 (25 μM) (CKIP-1+LY) for 4 h or wortmannin (300 nM) for 15 min (CKIP-1+W). Eighteen hours after transfection, cells were fixed and analyzed by indirect immunofluorescence for CKIP-1 (red) and cotransfected mutant p85 (green). Immunofluorescence was performed with a rabbit anti-CKIP-1 polyclonal antibody together with mouse anti-p85. Staining was visualized by confocal microscopy. Bar, 5 μm.
FIG. 6.
FIG. 6.
CKIP-1 accelerates the initial peak of proliferation following DM addition and subsequently promotes cell fusion. (A) Immunoblot of wild-type and mutant CKIP-1 proteins transiently transfected in C2C12 cells. Cells were transfected with pcDNA3-CKIP-1, pcDNA3-CKIP-1ΔPH, or the empty pcDNA3 vector. Transfected cells were cultured for 18 h and cell lysates were analyzed by Western blotting with the anti-CKIP-1 polyclonal antibody. Fifty micrograms of total proteins was loaded. Due to a short exposure, endogenous CKIP-1 cannot be observed in exogenous CKIP-1 and CKIP-1ΔPH lanes. (B) Transfected cells were kept in GM for 18 h after transfection. Then they were trypsinized and replated at the same density (3,000 cells per well) in 96-well plates. Each condition was tested in triplicate. Twelve hours later, they were shifted into DM. At different times following addition of DM, viable-cell numbers were monitored in a WST-1 colorimetric assay. Results are expressed as proliferation indexes; i.e., ratio of the number of viable cells at a given time to the number of viable cells 24 h earlier. Data are means ± standard errors of the means for triplicates of one experiment. Two independent experiments were performed. (C) Relative BrdU incorporation and proliferation indexes in CKIP-1-overexpressing cells. The experimental procedure described for panel A was used, and BrdU was added at different times after addition of DM. Twenty-four hours later, BrdU incorporation was measured by ELISA and normalized to viable-cell numbers measured in a WST-1 assay. Results are expressed as the ratio of BrdU incorporation (gray symbols) and proliferation indexes (white symbols) in pcDNA3-CKIP-1-transfected cells versus empty-vector-transfected control cells. Data are means ± standard errors of the means for triplicates of one experiment. Two independent experiments were performed. (D) (Top) Morphological aspects of CKIP-1-overexpressing C2C12 myotubes. C2C12 cells were transiently transfected with pcDNA3-CKIP-1 (CKIP-1) or the empty pcDNA3 vector (V). Eighteen hours following transfection, cells were replated at the same density and shifted to DM. Seventy-two hours after addition of the DM, cells were fixed and analyzed by indirect immunofluorescence for CKIP-1 (red) using a rabbit anti-CKIP-1 polyclonal antibody. The nuclei were stained with Hoechst reagent 33358. Staining was visualized by regular microscopy. PC, phase-contrast image of the same field. Bar, 5 μm. (Bottom) Myotubes distribution according to the number of nuclei (left) and average number of nuclei per myotubes (right) in control empty pcDNA3 vector (black bars) and pcDNA3-CKIP-1 (white bars) transfected C2C12 cells 72 h after DM addition. One hundred different control and CKIP-1-overexpressing myotubes were examined for each condition. Numbers above the bars (right) indicate the percentage of differentiation, i.e., proportion of cells containing three or more nuclei. Only these cells were considered for the calculation of the average of nuclei per myotube.
FIG. 7.
FIG. 7.
CKIP-1 modulates accumulation of transcripts encoding myoblast proliferation and differentiation markers. Myogenin, IGF-II, cyclin D1, and p21 mRNA expression in C2C12 cells transfected with control empty pcDNA3 vector (V), pcDNA3-CKIP-1, and pcDNA3-CKIP-1ΔPH. Cells were first grown for 18 h in GM following transfection and then shifted to DM (time zero). At various time points after addition of DM, total mRNA was extracted, and the amount of mRNA for myogenin, IGF-II, cyclin D1, and p21 were quantified by real-time quantitative RT-PCR. An hypoxanthine-guanine phosphoribosyltransferase RT-PCR control reaction was carried out to normalize the amount of mRNA included in each RT-PCR. Each measure was performed in duplicate. Results are expressed as the increase relative to empty pCDNA3 vector-transfected cells at time zero (before the addition of DM). Data are means of duplicates of one representative experiment. Four independent experiments were performed.
FIG. 8.
FIG. 8.
Interference with the PI3-K pathway modifies CKIP-1-induced proliferation and CKIP-1-stimulated myogenin expression. C2C12 cells were transfected with pcDNA3-wt CKIP-1 alone or empty vector (V). Transfected cells were kept in GM for 18 h after transfection. After replating as for Fig. 6B and Fig. 7A, they were shifted into DM. Under some conditions, transfected cells were treated with LY294002 (25 μM) (LY). At different times following addition of DM, viable-cell number (left) was monitored in a WST-1 assay. Results are expressed as in Fig. 7A. Data are means ± standard errors of the means for triplicates of one experiment. Myogenin expression (right) was quantified by real-time quantitative RT-PCR as for Fig. 6A. Two (WST-1 assay) and three (myogenin) independent experiments were performed.
FIG. 9.
FIG. 9.
Silencing of CKIP-1 by siRNA abolishes the initial proliferative phase after DM addition and delays the expression of myogenin and p21. C2C12 cells were transfected with the double-stranded RNA specific for CKIP-1 (siRNA) or the sense strand alone (control). Forty-eight hours after transfection, cells were trypsinized and replated in 96- and 12-well plates. Twelve hours later, they were shifted into DM and at different time points, total protein extracts were prepared for CKIP-1, myogenin, p21, and tubulin expression analysis by immunoblotting and measure of BrdU incorporation. (A) Immunoblots for CKIP-1, myogenin, p21, and tubulin in control and CKIP-1 siRNA cells. (B) BrdU incorporation at different times following addition of DM in CKIP-1 siRNA cells and control cells. BrdU incorporation was normalized to viable-cell number. Data are means ± standard errors of the means for triplicates of one experiment. Two independent experiments were performed.

References

    1. Alessi, D. R., S. R. James, C. P. Downes, A. B. Holmes, P. R. Gaffney, C. B. Reese, and P. Cohen. 1997. Characterization of a 3-phosphoinositide-dependent protein kinase which phosphorylates and activates protein kinase B alpha. Curr. Biol. 7:261-269. - PubMed
    1. Andreucci, J. J., D. Grant, D. M. Cox, L. K. Tomc, R. Prywes, D. J. Goldhamer, N. Rodrigues, P. A. Bedard, and J. C. McDermott. 2002. Composition and function of AP-1 transcription complexes during muscle cell differentiation. J. Biol. Chem. 277:16426-16432. - PubMed
    1. Bosc, D. G., K. C. Graham, R. B. Saulnier, C. Zhang, D. Prober, R. D. Gietz, and D. W. Litchfield. 2000. Identification and characterization of CKIP-1, a novel pleckstrin homology domain-containing protein that interacts with protein kinase CK2. J. Biol. Chem. 275:14295-142306. - PubMed
    1. Buj-Bello, A., V. Laugel, N. Messaddeq, H. Zahreddine, J. Laporte, J. F. Pellissier, and J. L. Mandel. 2002. The lipid phosphatase myotubularin is essential for skeletal muscle maintenance but not for myogenesis in mice. Proc. Natl. Acad. Sci. USA 99:15060-15065. - PMC - PubMed
    1. Calera, M. R., and P. F. Pilch. 1998. Induction of Akt-2 correlates with differentiation in Sol8 muscle cells. Biochem. Biophys. Res. Commun. 251:835-841. - PubMed

Publication types

Substances

LinkOut - more resources