. 2004 Feb;24(3):1387-400.
doi: 10.1128/MCB.24.3.1387-1400.2004.

RNA folding affects the recruitment of SR proteins by mouse and human polypurinic enhancer elements in the fibronectin EDA exon

Affiliations

RNA folding affects the recruitment of SR proteins by mouse and human polypurinic enhancer elements in the fibronectin EDA exon

Emanuele Buratti et al. Mol Cell Biol. 2004 Feb.

Abstract

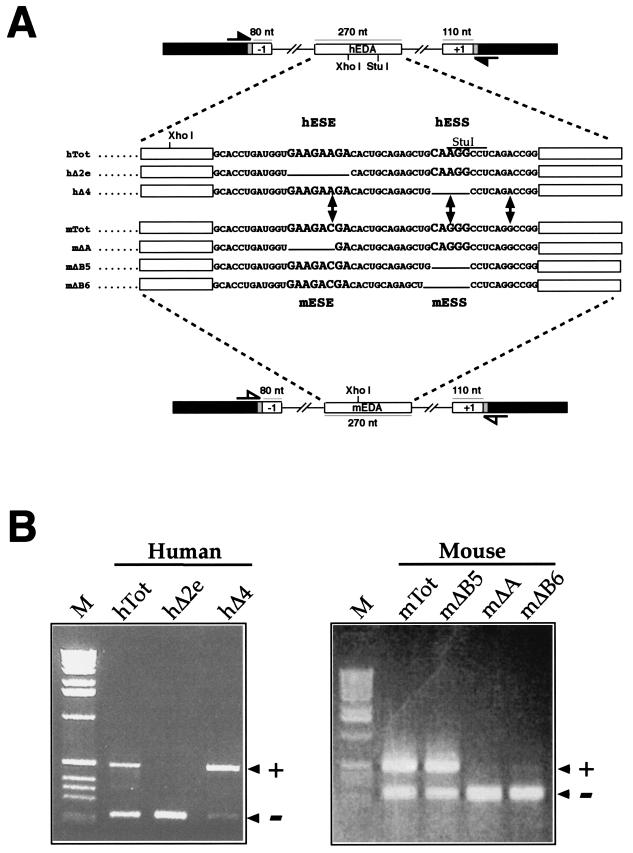
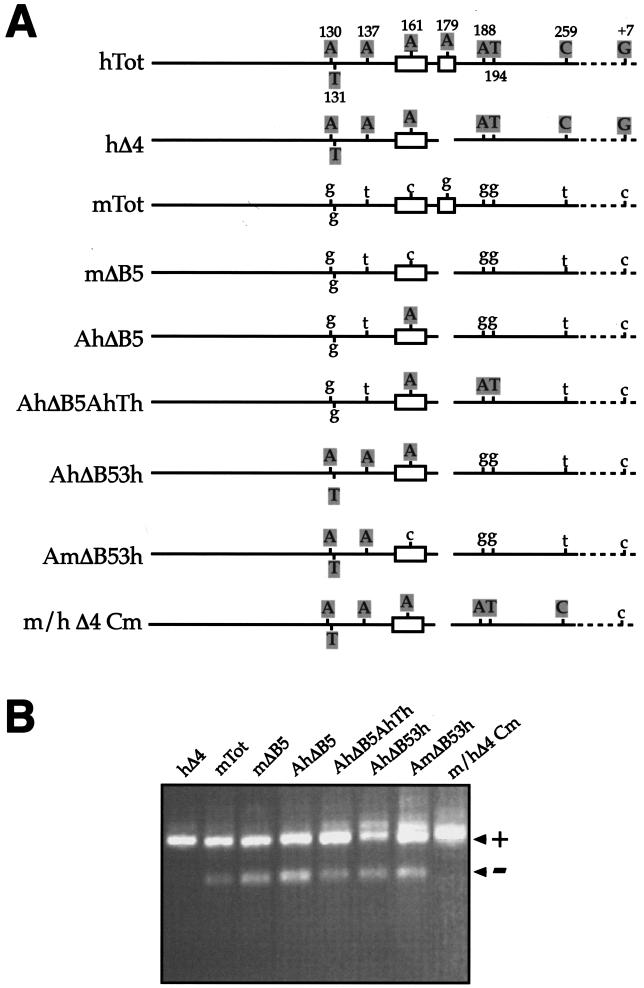
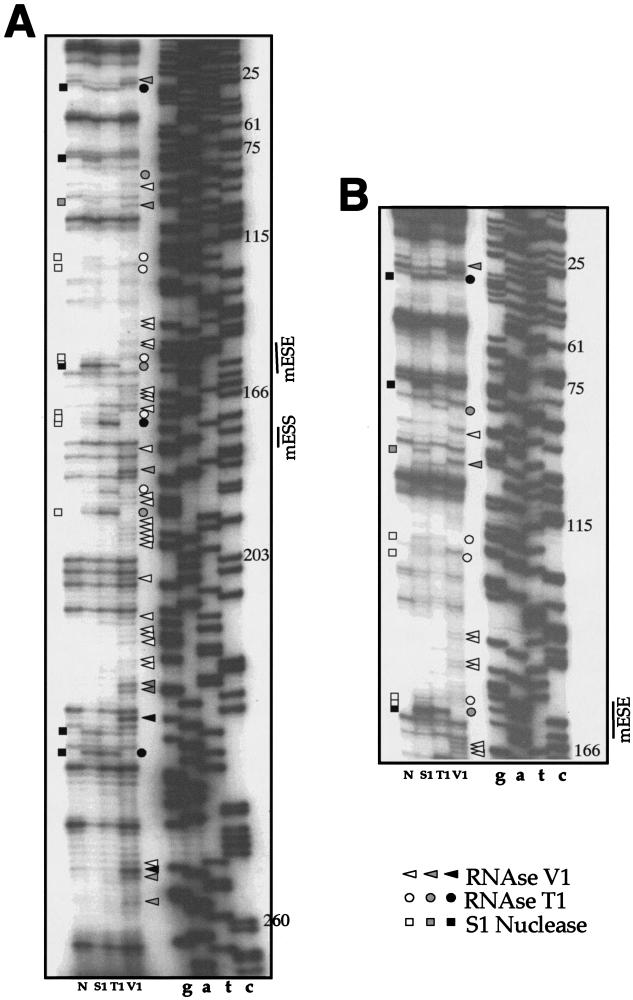
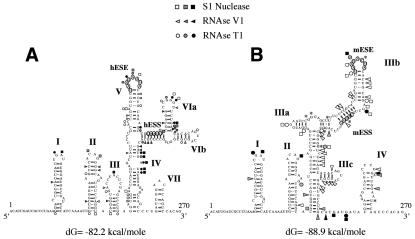
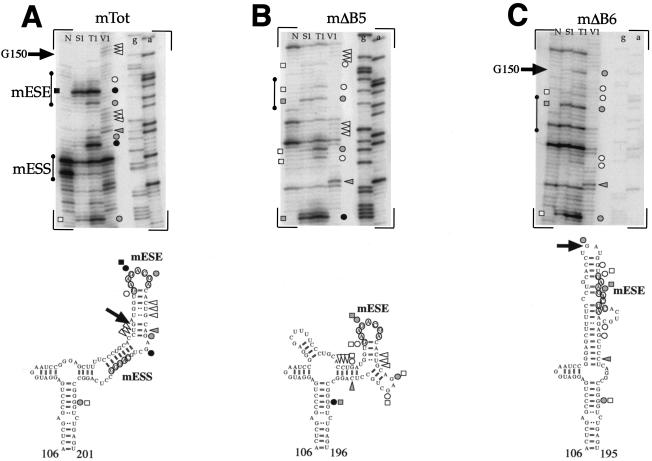
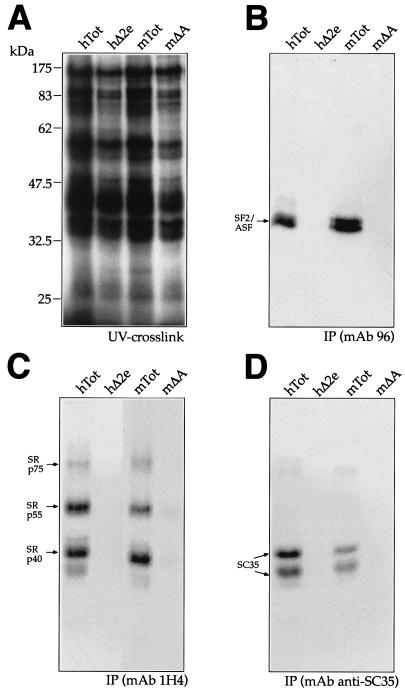
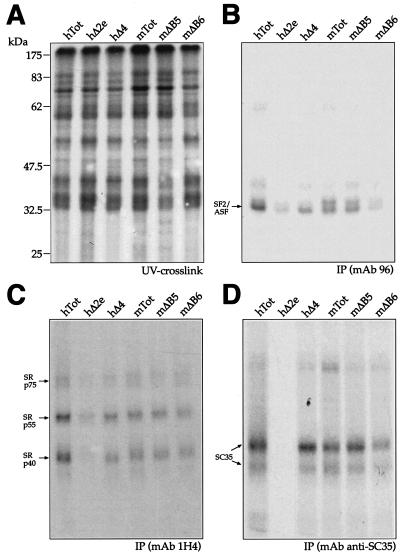
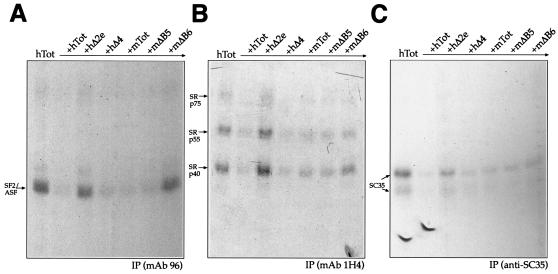
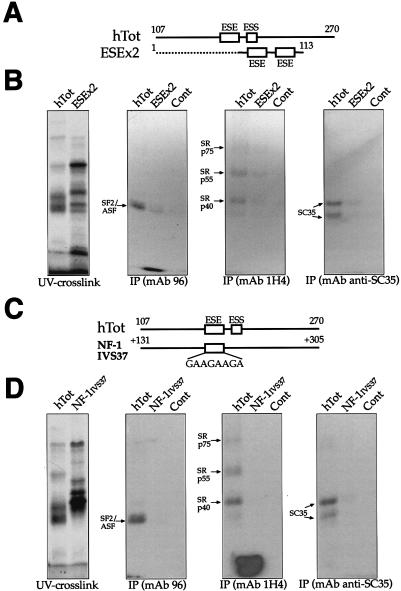
In humans, inclusion or exclusion of the fibronectin EDA exon is mainly regulated by a polypurinic enhancer element (exonic splicing enhancer [ESE]) and a nearby silencer element (exonic splicing silencer [ESS]). While human and mouse ESEs behave identically, mutations introduced into the homologous mouse ESS sequence result either in no change in splicing efficiency or in complete exclusion of the exon. Here, we show that this apparently contradictory behavior cannot be simply accounted for by a localized sequence variation between the two species. Rather, the nucleotide differences as a whole determine several changes in the respective RNA secondary structures. By comparing how the two different structures respond to homologous deletions in their putative ESS sequences, we show that changes in splicing behavior can be accounted for by a differential ESE display in the two RNAs. This is confirmed by RNA-protein interaction analysis of levels of SR protein binding to each exon. The immunoprecipitation patterns show the presence of complex multi-SR protein-RNA interactions that are lost with secondary-structure variations after the introduction of ESE and ESS variations. Taken together, our results demonstrate that the sequence context, in addition to the primary sequence identity, can heavily contribute to the making of functional units capable of influencing pre-mRNA splicing.


Figures

FIG.1.
FIG.1.
Changes in mouse and human FN EDA alternative splicing caused by the introduction of deletions into the ESE and ESS regulatory regions. (A) Schematic representation of the human and mouse minigenes. The FN exons and introns are labeled by white boxes and lines, linker sequences are shadowed, and α-globin exon 3 is indicated by black boxes. The locations of the primers used in the RT-PCR assay are shown: closed arrows indicate human-specific primers, while open arrows indicate mouse-specific primers. The sequence of the exonic region involved in EDA splicing regulation is reported for the human wild-type minigene (hTot) and mutants carrying a deletion of the ESE (hΔ2e), ESS (hΔ4) or for the mouse wild-type minigene (mTot) and mutants carrying a deletion of the mESE (mΔA) or mESS (mΔB5 and mΔB6). The respective ESE (hESE and mESE) and ESS (hESS and mESS) sequences are in bigger characters. (B) RT-PCR analysis of total RNA from cells expressing each of the indicated constructs in the NIH 3T3 cell line. PCR products either containing (+) or lacking (−) the FN EDA exon in the messenger transcribed from the transfected minigene are indicated. M, molecular weight markers (1 kb; BRL).
FIG.2.
FIG.2.
Effects on the splicing process of gradually humanizing the mΔB5 mouse sequence to the hΔ4 sequence. (A) Schematic diagram of each mutant analyzed with the minigene system in NIH 3T3 cells. Open boxes represent the ESE and ESS sequences, respectively. Uppercase letters represent human nucleotides, while lowercase letters denote mouse nucleotides. On the human sequence, nucleotides are numbered. Straight lines represent exonic sequences, while broken lines represent intronic sequences. For clarity, the diagrams have not been drawn to scale. (B) RT-PCR analysis of total RNA from cells expressing each of the indicated constructs in the NIH 3T3 cell line. PCR products either containing (+) or lacking (−) the FN EDA exon in the messenger transcribed from the transfected minigene are indicated.
FIG.3.
FIG.3.
Enzymatic determination of the RNA secondary structure of the mouse EDA exon. In vitro-transcribed mTot RNA was enzymatically digested with S1 nuclease and RNases T1 and V1 and reverse transcribed with an antisense primer. The RT products were separated on a sequencing polyacrylamide gel. A sequencing reaction (numbered according to the exon length) performed with the same primer was run in parallel with the cleavages in order to precisely determine the cleavage sites. In order to cover the whole exon length, short (A) and long (B) runs were performed. Squares, circles, and triangles indicate S1 nuclease and RNase T1 and V1 cleavage sites, respectively. Black, shaded, and white symbols indicate high, medium, and low cleavage intensities, respectively. No enzyme was added to the reaction mixture in lane N. The mESS and mESE positions are marked on the right of each sequencing reaction.
FIG. 4.
FIG. 4.
Comparison of the RNA secondary structure of the human (A) and mouse (B) wild-type EDA sequences. The two structures were optimized by computer-assisted RNA modeling, and the respective ESE and ESS elements are circled to facilitate their localization. Squares, circles, and triangles indicate S1 nuclease and RNase T1 and V1 cleavage sites, respectively. Black, shaded, and white symbols indicate high, medium, and low cleavage intensities, respectively. The asterisks in the mouse secondary-structure model mark the nucleotide differences between the mouse and human nucleotide sequences.
FIG. 5.
FIG. 5.
Secondary-structure analysis of the ESE region in the mTot (A), mΔB5 (B), and mΔB6 (C) constructs. The in vitro-transcribed RNAs were enzymatically digested with S1 nuclease and RNases T1 and V1 and reverse transcribed, and the RT products were separated on a sequencing polyacrylamide gel. No enzyme was added to the reaction mixture in lane N. The regions containing the ESE and ESS elements are shown by a vertical line. The upper part of each panel shows the enzymatic analysis of RNA templates of mTot, mΔB5, and mΔB6 constructs. The bottom part reports the cleavages on the optimized secondary-structure predictions. Squares, circles, and triangles indicate S1 nuclease and RNase T1 and V1 cleavage sites, respectively. Black, shaded, and white symbols indicate high, medium, and low cleavage intensities, respectively. The arrow indicates the position of G150, which is present in a stem position in the mTot RNA but shifts to a loop configuration in the mΔB6 mutant.
FIG. 6.
FIG. 6.
UV cross-linking analysis of the wild-type human and mouse sequences (hTot and mTot) and ESE deletion-carrying mutants (hΔ2e and mΔA) with HeLa nuclear extract. Each RNA was labeled with [α-32P]UTP and then incubated with approximately 150 μg of HeLa nuclear extract before being subjected to UV cross-linking and digestion with RNase. Samples were then run on an SDS-11% PAGE gel and exposed to BioMax autoradiographic film. The electrophoretic mobility of prestained markers (Broad Range; New England Biolabs) is shown on the left (A). IP was then performed with equal amounts of each UV cross-linked sample shown in panel A with specific MAbs against different SR proteins: SF2/ASF (B, MAb 96), the phosphorylated RS domain (C, MAb 1H4), and SC35 (D, anti-SC35). The mobility of the SR proteins is indicated on the left. The SF2/ASF antibody immunoprecipitates more than one protein band owing to the presence of differently phosphorylated forms, as specified by the manufacturer.
FIG. 7.
FIG. 7.
UV cross-linking analysis of human and mouse mutants with HeLa nuclear extract. Each RNA was labeled with [α-32P]UTP and then incubated with HeLa nuclear extract before being subjected to UV cross-linking and digestion with RNase. Samples were then run on an SDS-11% PAGE gel and exposed to BioMax autoradiographic film. The electrophoretic mobility of prestained molecular size markers (Broad Range; New England Biolabs) is shown on the left (A). IP was then performed with the same amount of each UV cross-linked sample shown in panel A with specific MAbs against different SR proteins: SF2/ASF (B, MAb 96), the phosphorylated RS domain (C, MAb 1H4), and SC35 (D, anti-SC35). The mobility of the SR proteins is indicated on the left. The SF2/ASF antibody immunoprecipitates more than one protein band owing to the presence of differently phosphorylated forms, as specified by the manufacturer.
FIG. 8.
FIG. 8.
Competition and IP analysis of unlabeled mouse and human EDA sequences in the presence of labeled hTot RNA. Competition prior to UV cross-linking was performed by incubating labeled hTot RNA and HeLa nuclear extracts with equal amounts of unlabeled hTot, hΔ2e, hΔ4, mTot, mΔB5, and mΔB6 (in approximately fivefold molar excess) before IP analysis. IPs were performed with specific MAbs against SF2/ASF (A, MAb 96), the phosphorylated RS domain (B, MAb 1H4), and SC35 (C, anti-SC35). The mobility of the SR proteins is indicated on the left. Samples were run on an SDS-11% PAGE gel and exposed to BioMax autoradiographic film.
FIG. 9.
FIG. 9.
IP analysis comparing the recruitment of SR proteins by human ESE sequences alone (GAAGAAGA) as opposed to the full EDA exon. (A) Comparison of the two RNAs used in this experiment: the hTot RNA contains the ESE within its original context (nt 107 to 270), while the ESEx2 RNA contains two copies of the ESE element (flanked only by 8 nt of the EDA sequence) at the 3′ end of pBluescript II SK+ sequences (dotted line). Numbering on the ESEx2 construct refers to the distance from the T3 RNA polymerase promoter on pBluescript II SK+. A control RNA is also included. IPs (B) were performed with equal amounts of the UV cross-linked samples and with the different specific MAbs against SR proteins: SF2/ASF (MAb 96), the phosphorylated RS domain (MAb 1H4), and SC35 (anti-SC35). The leftmost gel contains the total UV cross-linked proteins prior to IP. (C) Comparison of the hTot RNA with a naturally occurring, 170-nt-long intronic region containing a GAAGAAGA sequence from IVS37 of the NF-1 gene. The numbering on the IVS37 construct refers to intronic nucleotide positions starting from the 5′ splice site of NF-1 exon 37. (D) IP profile of these two sequences with the same antibodies used in panel B. As above, the leftmost gel contains the total UV cross-linked proteins prior to IP. In all of the gels, the mobility of the SR proteins is indicated on the left. Samples were run on an SDS-11% PAGE gel and exposed to BioMax autoradiographic film.

References

    1. Adams, M. D., D. Z. Rudner, and D. C. Rio. 1996. Biochemistry and regulation of pre-mRNA splicing. Curr. Opin. Cell Biol. 8:331-339. - PubMed
    1. Balvay, L., D. Libri, and M. Y. Fiszman. 1993. Pre-mRNA secondary structure and the regulation of splicing. Bioessays 15:165-169. - PubMed
    1. Black, D. L. 1991. Does steric interference between splice sites block the splicing of a short c-src neuron-specific exon in non-neuronal cells? Genes Dev. 5:389-402. - PubMed
    1. Blanchette, M., and B. Chabot. 1997. A highly stable duplex structure sequesters the 5′ splice site region of hnRNP A1 alternative exon 7B. RNA 3:405-419. - PMC - PubMed
    1. Blencowe, B. J. 2000. Exonic splicing enhancers: mechanism of action, diversity and role in human genetic diseases. Trends Biochem. Sci. 25:106-110. - PubMed

Publication types

Grants and funding