. 2004 Jan;134(1):18-27.
doi: 10.1104/pp.103.027151.

Gene trapping with firefly luciferase in Arabidopsis. Tagging of stress-responsive genes

Affiliations

Gene trapping with firefly luciferase in Arabidopsis. Tagging of stress-responsive genes

Martha C Alvarado et al. Plant Physiol. 2004 Jan.

Abstract

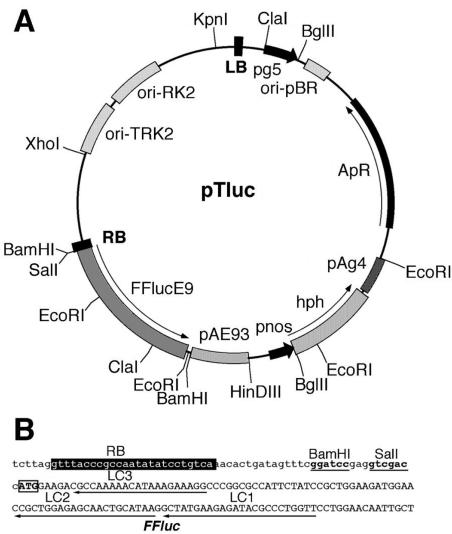
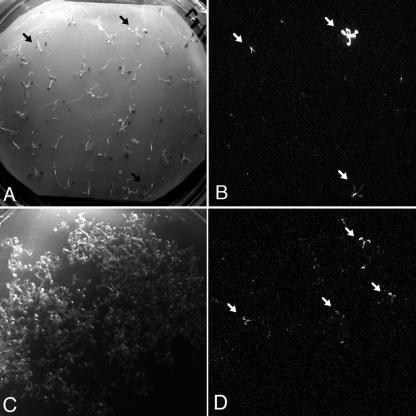
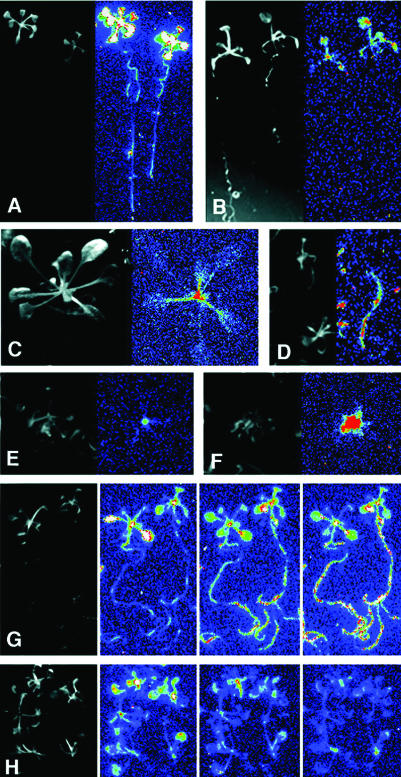
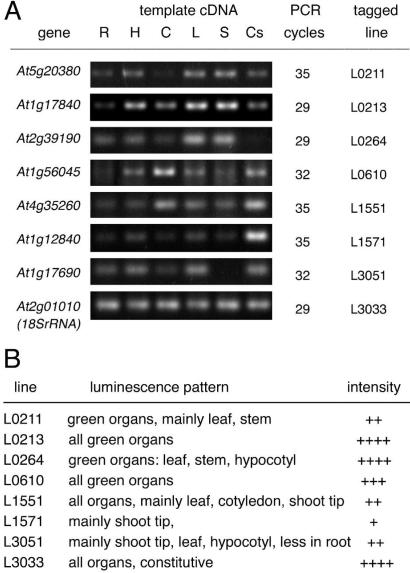
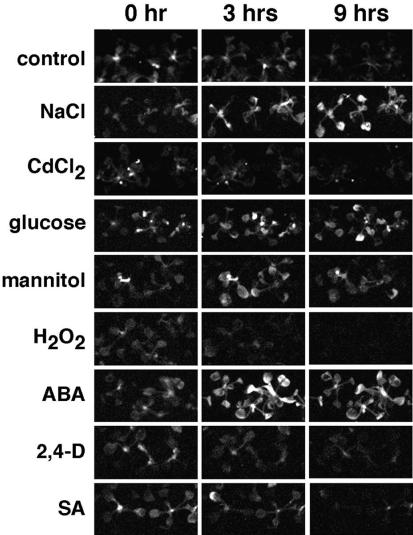
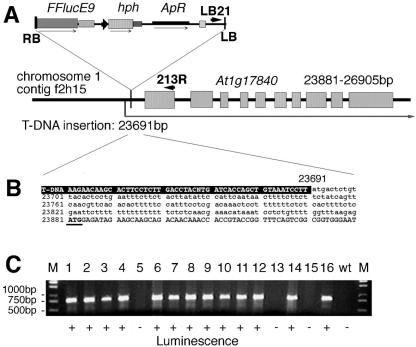
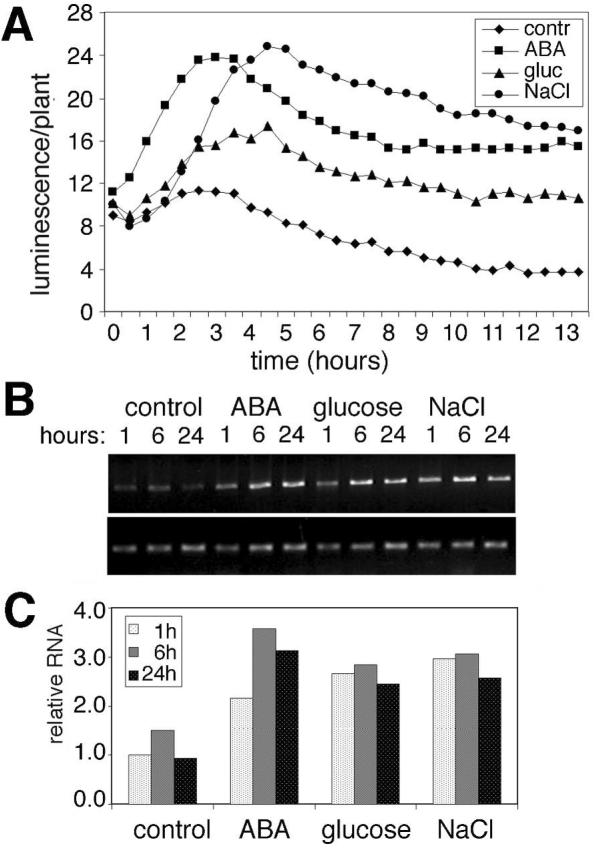
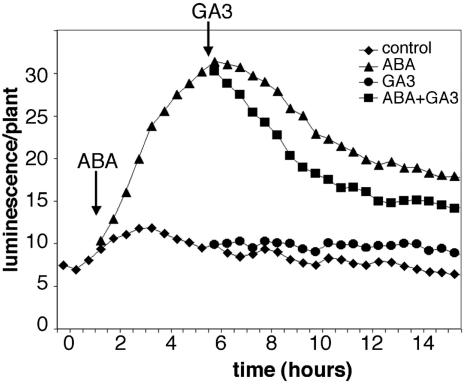
To monitor the expression of T-DNA-tagged plant genes in vivo, a collection of 20,261 transgenic lines of Arabidopsis (Columbia-0) were generated with the promoter trap vector pTluc, which carries a promoterless firefly luc (luciferase) reporter gene linked to the right T-DNA border. By detection of bioluminescence in 3-week-old seedlings, 753 lines were identified showing constitutive, organ-specific, and stress-responsive luciferase expression patterns. To facilitate the identification of well-defined luciferase expression patterns, a pooled seed stock was established. Several lines showed sugar, salt, and abscisic acid (ABA)-inducible luciferase activity. Segregation analysis of 215 promoter trap lines indicated that about 50% of plants contained single insertions, whereas 40% carried two and 10% carried three or more T-DNA tags. Sequencing the T-DNA insert junctions isolated from 17 luciferase-expressing lines identified T-DNA tags in 5'- and 3'-transcribed domains and translational gene fusions generated by T-DNA insertions in exons and introns of Arabidopsis genes. Tissue specific expression of eight wild-type Arabidopsis genes was confirmed to be similar to the luminescence patterns observed in the corresponding luciferase-tagged lines. Here, we describe the characterization of a transcriptional luc reporter gene fusion with the WBC-type ABC transporter gene At1g17840. Expression of wild-type and luciferase-tagged At1g17840 alleles revealed similar induction by salt, glucose, and ABA treatments and gibberellin-mediated down-regulation of ABA-induced expression. These results illustrate that luciferase gene traps are well suited for monitoring the expression of stress-responsive Arabidopsis genes in vivo.


Figures

Figure 1.
Figure 1.
The pTluc promoter trap vector. A, Restriction map of the pTLuc vector. pg5, promoter of T-DNA gene 5; ori/pBR, replication origin from plasmid pBR322; ApR/CbR, bacterial ampicillin/carbenicillin resistance marker; pAg4, 3′ poly(A+) signal sequence of T-DNA gene4; hph, hygromycin phosphotransferase gene; pnos, nopaline synthase promoter; FFluc, firefly luciferase gene; pAE93, 3′ polyA region of gene E93. B, Sequence of the right border (RB) region. Position of the T-DNA RB is shown by white letters on black background. Sequences of BamHI and SalI restriction sites are underlined. ATG of the FFLuc reporter gene is boxed. The position of oligonucleotides LC1, LC2, and LC3 is indicated by arrows.
Figure 2.
Figure 2.
Identification of luciferase gene fusions in the pTluc-transformed Arabidopsis population. A, Light image of 45 screened T1 seedlings. B, Luminescence image of the screened plants. Different patterns of luciferase activity are detectable in three plants. C, Identification of a luciferase gene fusion in pooled seed stocks. Image of 500 screened seedlings. D, Detection of luminescence in the pooled seedlings.
Figure 3.
Figure 3.
Examples for characteristic luciferase expression patterns in tagged Arabidopsis plants. Images show 3- to 4-week-old plants in light (left) and the corresponding luminescence pattern (right). Colors correspond to increasing luminescence intensity in the following order: blue < green < yellow < red < white. Luminescence patterns: A, constitutive (L3033); B, all green organs (L0213); C, petioles and shoot tip (L6180); D, root (L6318); E, shoot apex (L6331); and F, young leaves (L6365). G and H, Salt-responsive luciferase activity in T2 plants, which were challenged by high-salt medium. Luminescence was recorded at 0, 2, and 6 h after transfer. G, Salt-induced luminescence in roots (L1518). H, Salt-repressed luminescence (L6177).
Figure 4.
Figure 4.
Expression analysis of eight Arabidopsis genes. A, Total RNA was isolated from root (R), hypocotyl (H), cotyledon (C), leaf (L), and stem (S) tissues of 3-week-old in vitro-germinated plants and cell suspension cultures (Cs). RT-PCR was performed on equal amount of cDNA templates, using gene-specific primer pairs. PCR fragments are shown after 29 to 35 cycles of amplification. Strong expression levels required lower amplification cycles, whereas more cycles are needed to amplify fragments from low-abundance transcripts. 18SrRNA gene (At2g01010) was used as constitutive control. B, Luminescence pattern and intensity in the tested Arabidopsis lines. Approximate light intensities are shown in arbitrary scale from low (+) to high (++++).
Figure 5.
Figure 5.
Stress- and hormone-responsive luciferase activity in line L0213. Three-week-old plants were transferred to media supplemented by following additives: 250 mm NaCl, 1 mm CdCl2, 400 mm Glc, 400 mm mannitol, 8 mm hydrogen peroxide (H2O2), 50 μm ABA, 1 μm 2,4-dichlorophenoxyacetic acid (2,4-D), and 1 μm salicylic acid. Luminescence was recorded in multiple time points and is shown here after 0, 3, and 9 h of treatments.
Figure 6.
Figure 6.
Mapping and segregation of T-DNA insertion in line L0213. A, T-DNA insertion is located in chromosome 1, at 23,691 bp of contig f2H15, in the 5′-UTR of gene At1g17840. Exon-intron structure of the At1g17840 gene, position, and structural elements of the pTluc insert are indicated. Position of LB and gene-specific PCR primers (LB21 and 213R, respectively) are shown by arrowheads. B, Sequence of the T-DNA and plant DNA junction. Left border (LB) sequence of the T-DNA is shown by white letters on black background. Sequence of 5′-UTR is indicated by lowercase, and the first exon is shown by capital letters. The predicted ATG codon is underlined. C, Segregation of the T-DNA insert and luminescence in 16 independent T2 plants. Test PCR was performed using genomic DNA isolated from individual plants and combination of gene-specific (213R) and T-DNA-specific (LB21) primers. M, DNA size marker; 1 to 16, amplification of 760-bp PCR fragment in independent T2 plants; wt, wild type Columbia-0 plant. Plants 5, 13, and 15 had no luciferase activity and produced only hygromycin-sensitive progeny. All the other plants showed luminescence.
Figure 7.
Figure 7.
Analysis of At1g17840 expression. A, Kinetics of salt, sugar, and ABA-responsive luciferase expression in line L0213. Three-week-old plants were transferred to MSAR media containing 250 mm NaCl, 400 mm Glc, or 50 μm ABA, and luminescence was recorded in 30-min intervals. B, RT-PCR analysis of At1g17840 expression. Total RNA was isolated from 3-week-old plants treated with 250 mm NaCl, 400 mm Glc, or 50 μm ABA for 1, 6, or 24 h. Equal amounts of cDNA templates were used for PCR amplification of gene-specific fragments using primers L213A and L213B. Upper row, At1g17840-specific PCR fragments are shown after 29 cycles of amplification (ABC). Lower row, PCR fragments corresponding to the ubiquitin 10 gene are shown after 23 cycles (UBI). C, Quantification of the PCR analysis. Average values of three measurements were normalized to control RNA.
Figure 8.
Figure 8.
Effect of sequential ABA and GA treatments on luciferase activity of line L0213. Two-week-old plants were sprayed by 100 μm ABA and 5 h later by 100 μm GA3 (see arrows). ABA-responsive activation of At1g17840::luc gene fusion could be repressed by GA3.

References

    1. Allen ND, Cran DG, Barton SC, Hettle S, Reik W, Surani MA (1988) Transgenes as probes for active chromosomal domains in mouse development. Nature 333: 852-855 - PubMed
    1. Arabidopsis Genome Initiative (2000) Analysis of the genome sequence of the flowering plant Arabidopsis thaliana. Nature 408: 796-815 - PubMed
    1. Barthels N, Van der Lee FM, Klap J, Goddijn OJ, Karimi M, Puzio P, Grundler FM, Ohl SA, Lindsey K, Robertson L et al. (1997) Regulatory sequences of Arabidopsis drive reporter gene expression in nematode feeding structures. Plant Cell 9: 2119-2134 - PMC - PubMed
    1. Bechtold N, Pelletier G (1998) In planta Agrobacterium-mediated transformation of adult Arabidopsis thaliana plants by vacuum infiltration. Methods Mol Biol 82: 259-266 - PubMed
    1. Bellen HJ, O'Kane CJ, Wilson C, Grossniklaus U, Pearson RK, Gehring WJ (1989) P-element-mediated enhancer detection: a versatile method to study development in Drosophila. Genes Dev 3: 1288-1300 - PubMed

Publication types