

Confirmation of linkage to chromosome 1q for peak vertebral bone mineral density in premenopausal white women
- PMID: 14730478
- PMCID: PMC1181920
- DOI: 10.1086/381401
Confirmation of linkage to chromosome 1q for peak vertebral bone mineral density in premenopausal white women
Abstract
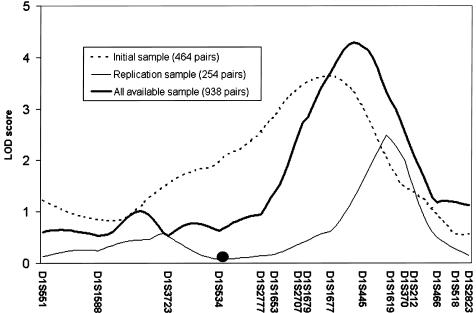
Peak bone mineral density (BMD) is a highly heritable trait and is a good predictor of the risk of osteoporosis and fracture in later life. Recent studies have sought to identify the genes underlying peak BMD. Linkage analysis in a sample of 464 premenopausal white sister pairs detected linkage of spine BMD to chromosome 1q (LOD 3.6). An independent sample of 254 white sister pairs has now been genotyped, and it also provides evidence of linkage to chromosome 1q (LOD 2.5) for spine BMD. Microsatellite markers were subsequently genotyped for a 4-cM map in the chromosome 1q region in all available white sister pairs (n=938), and a LOD score of 4.3 was obtained near the marker D1S445. Studies in the mouse have also detected evidence of linkage to BMD phenotypes in the region syntenic to our linkage finding on chromosome 1q. Thus, we have replicated a locus on 1q contributing to BMD at the spine and have found further support for the region in analyses employing an enlarged sample. Studies are now ongoing to identify the gene(s) contributing to peak spine BMD in women.
Figures
References
Electronic-Database Information
-
- Center for Inherited Disease Research, http://www.cidr.jhmi.edu
-
- Marshfield Center for Medical Genetics, http://research.marshfieldclinic.org/genetics/ (for chromosomal positions, marker order, and map positions)
References
-
- Beamer WG, Shultz KL, Donahue LR, Churchill GA, Sen S, Wergedal JR, Baylink DJ, Rosen CJ (2001) Quantitative trait loci for femoral and lumbar vertebral bone mineral density in C57BL/6J and C3H/HeJ inbred strains of mice. J Bone Miner Res 16:1195–1206 - PubMed
-
- Bell NH, Shary J, Stevens J, Garza M, Gordon L, Edwards J (1991) Demonstration that bone mass is greater in black than in white children. J Bone Miner Res 6:719–723 - PubMed
Publication types
MeSH terms
Substances
Grants and funding
LinkOut - more resources
Full Text Sources
Medical
Molecular Biology Databases
