. 2004 Jan 27;101(4):992-7.
doi: 10.1073/pnas.0307540100. Epub 2004 Jan 19.

Identifying gene regulatory elements by genome-wide recovery of DNase hypersensitive sites

Affiliations

Identifying gene regulatory elements by genome-wide recovery of DNase hypersensitive sites

Gregory E Crawford et al. Proc Natl Acad Sci U S A. .

Abstract

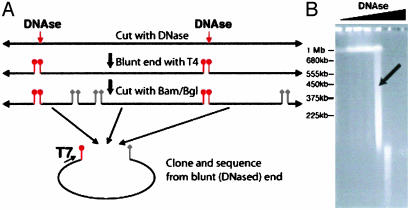
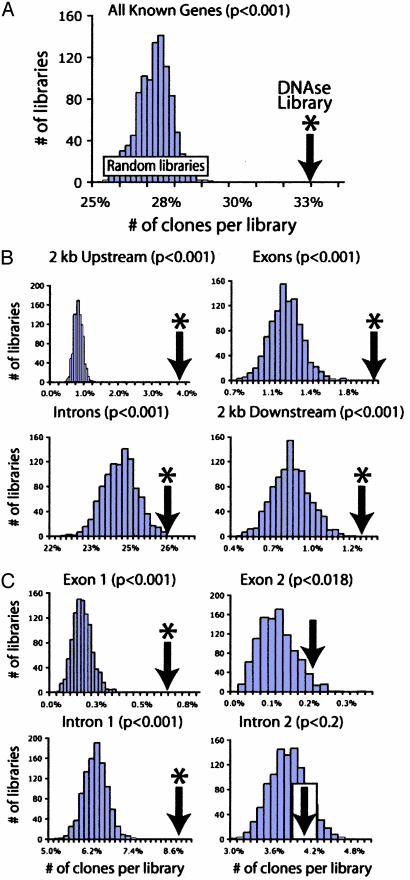
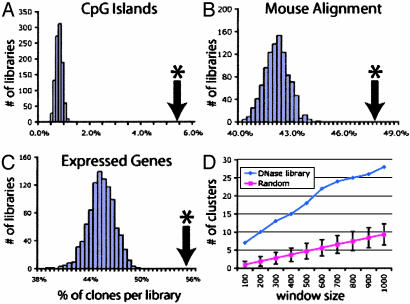
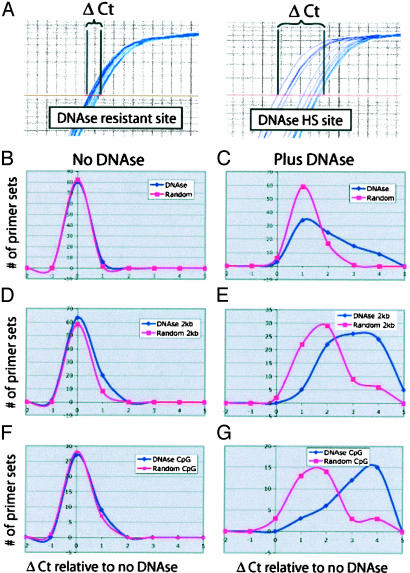
Analysis of the human genome sequence has identified approximately 25000-30000 protein-coding genes, but little is known about how most of these are regulated. Mapping DNase I hypersensitive (HS) sites has traditionally represented the gold-standard experimental method for identifying regulatory elements, but the labor-intensive nature of this technique has limited its application to only a small number of human genes. We have developed a protocol to generate a genome-wide library of gene regulatory sequences by cloning DNase HS sites. We generated a library of DNase HS sites from quiescent primary human CD4(+) T cells and analyzed approximately 5600 of the resulting clones. Compared to sequences from randomly generated in silico libraries, sequences from these clones were found to map more frequently to regions of the genome known to contain regulatory elements, such as regions upstream of genes, within CpG islands, and in sequences that align between mouse and human. These cloned sites also tend to map near genes that have detectable transcripts in CD4(+) T cells, demonstrating that transcriptionally active regions of the genome are being selected. Validation of putative regulatory elements was achieved by repeated recovery of the same sequence and real-time PCR. This cloning strategy, which can be scaled up and applied to any cell line or tissue, will be useful in identifying regulatory elements controlling global expression differences that delineate tissue types, stages of development, and disease susceptibility.


Figures

Fig. 1.
Fig. 1.
Cloning of DNase HS sites. (A) Cloning strategy. Intact nuclei are digested with DNase, and the DNase-digested ends are made blunt with T4 DNA polymerase. After digestion with BamHI and BglII, blunt/sticky fragments were ligated into pBluescript SK(+) and sequenced from the blunt (DNase-digested) end. (B) Pulsed-field electrophoresis of genomic CD4+ T cell DNA treated with increasing amounts of DNase. An arrow marks the concentration of DNase (1.2 units) from which the library was made.
Fig. 2.
Fig. 2.
Comparison of DNase HS site library (marked with arrows) relative to 1,000 random in silico libraries, which show a seminormal distribution. *, Significant differences (P < 0.01) between DNase HS site and random libraries. (A) Alignment to known genes. Thirty-three percent of DNase HS site coordinates map to a 2-kb window surrounding all known genes. (B) Each 2-kb gene window surrounding all known genes was divided into four segments: 2 kb upstream of genes, exons, and introns, and 2 kb downstream of genes. The DNase library is significantly enriched for all four regions (P < 0.001). (C) DNase HS site and random libraries were mapped to first and second exons and introns, and show that DNase HS site coordinates are significantly enriched for first exons and first introns but less so for second exons and not at all for second introns.
Fig. 3.
Fig. 3.
Comparison of DNase HS site and random libraries. (A) Alignment of libraries to CpG islands. A significant enrichment (*) of sequences was detected in the DNase HS library, compared to the random libraries. (B) Alignment of DNase HS and random in silico libraries to regions of the genome that align between mouse and human. Approximately 48% of the DNase HS library is within regions that align to mouse, a significantly different percentage than that of the random libraries. (C) Alignment of libraries to genes that are expressed in CD4+ T cells. The percentage of clones that land near or within a gene with detectable transcripts was determined for each library. (D) The number of clustered coordinates from DNase HS site and random libraries was determined within 100- to 1,000-bp windows.
Fig. 4.
Fig. 4.
Real-time PCR of putative DNase HS site and random coordinates. Intact CD4+ T cell nuclei were digested with increasing amounts of DNase and used for real-time PCR. (A) Amplification plot. Each curve represents amplification from lowest concentration of DNase to highest (left to right). The y axis represents the amount of PCR product, and the x axis is the number of cycles. The middle line is the threshold set during the linear phase of the PCR used to calculate the Ct value. Primer sets flanking DNase HS sites have larger ΔCt values when amplified from DNase-sensitive sites than from DNase-resistant sites. (B and C) Primer sets flanking nonbiased DNase HS site and random coordinates amplified from genomic DNA treated with no DNase (B) or plus DNase (C). The y axis represents the number of primer sets studied, and the x axis represents the additional number of cycles (ΔCt) required to amplify the same amount of template as with no DNase. (D and E) PCR primers flanking DNase HS site and random coordinates that are <2 kb upstream from genes amplified genomic DNA treated with no DNase (D) or plus DNase (E). (F and G) PCR primers flanking DNase and random libraries that map to CpG islands >2 kb from a gene-amplified genomic DNA treated with no DNase (F) or plus DNase (G).
Fig. 5.
Fig. 5.
Seven pairs of DNase HS site clones that map <400 bp from each other. Positions of DNase HS sites (arrows) are indicated relative to known genes, CpG islands, regions of conservation between human and mouse, and repetitive elements using the UCSC genome browser. Six pairs map within 2 kb upstream of a gene (A–F) and nearby or in CpG islands. Note that not all of these six pairs map to the most highly conserved regions between human and mouse. One pair maps 250 kb from any known gene (G) but is in a region that is highly conserved with mouse.

References

    1. Collins, F. S., Green, E. D., Guttmacher, A. E. & Guyer, M. S. (2003) Nature 422, 835–847. - PubMed
    1. Ureta-Vidal, A., Ettwiller, L. & Birney, E. (2003) Nat. Rev. Genet. 4, 251–262. - PubMed
    1. Thomas, J. W., Touchman, J. W., Blakesley, R. W., Bouffard, G. G., Beckstrom-Sternberg, S. M., Margulies, E. H., Blanchette, M., Siepel, A. C., Thomas, P. J., McDowell, J. C., et al. (2003) Nature 424, 788–793. - PubMed
    1. Slightom, J. L., Bock, J. H., Tagle, D. A., Gumucio, D. L., Goodman, M., Stojanovic, N., Jackson, J., Miller, W. & Hardison, R. (1997) Genomics 39, 90–94. - PubMed
    1. Lieb, J. D., Liu, X., Botstein, D. & Brown, P. O. (2001) Nat. Genet. 28, 327–334. - PubMed

Substances