. 2004 Jan 19;199(2):185-97.
doi: 10.1084/jem.20031064.

The activation status of neuroantigen-specific T cells in the target organ determines the clinical outcome of autoimmune encephalomyelitis

Affiliations

The activation status of neuroantigen-specific T cells in the target organ determines the clinical outcome of autoimmune encephalomyelitis

Naoto Kawakami et al. J Exp Med. .

Abstract

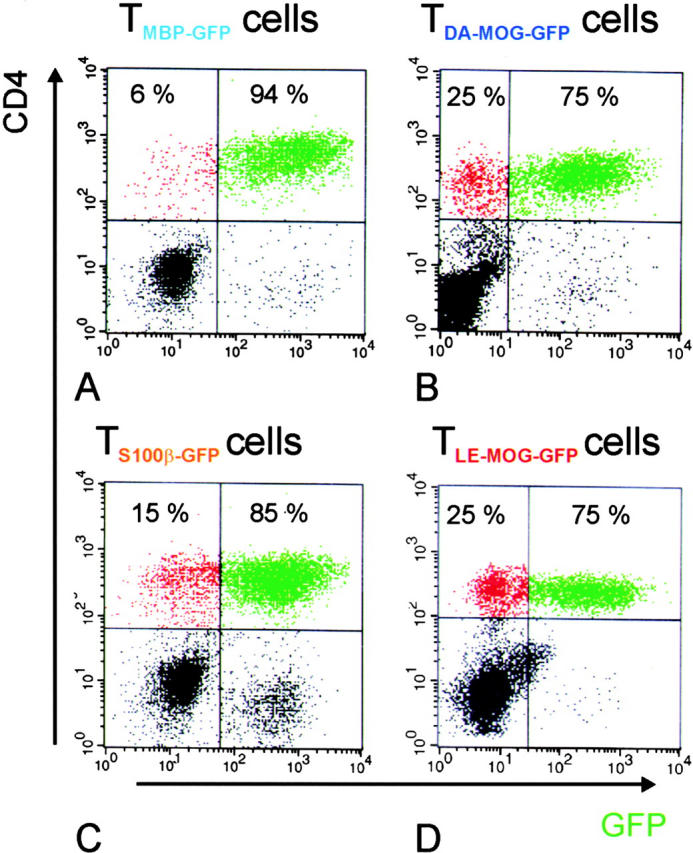
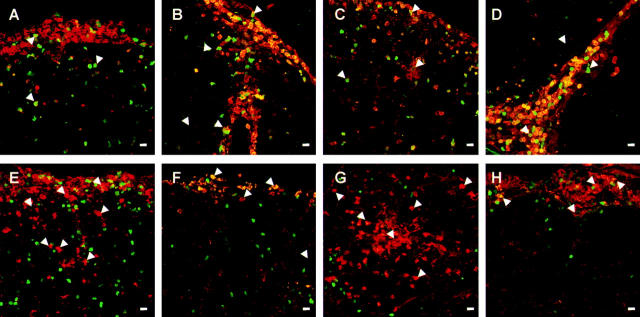
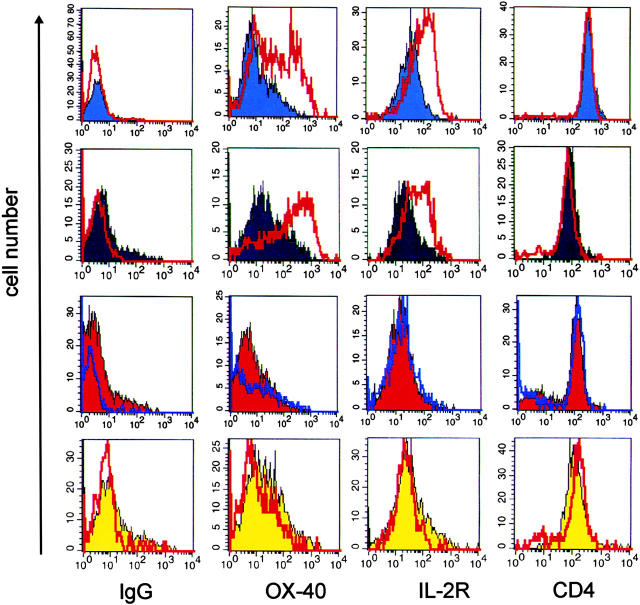
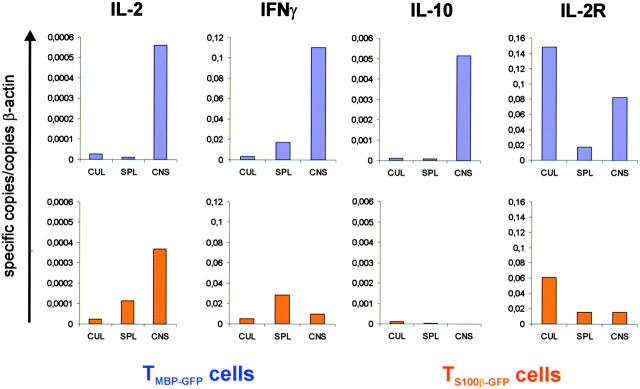
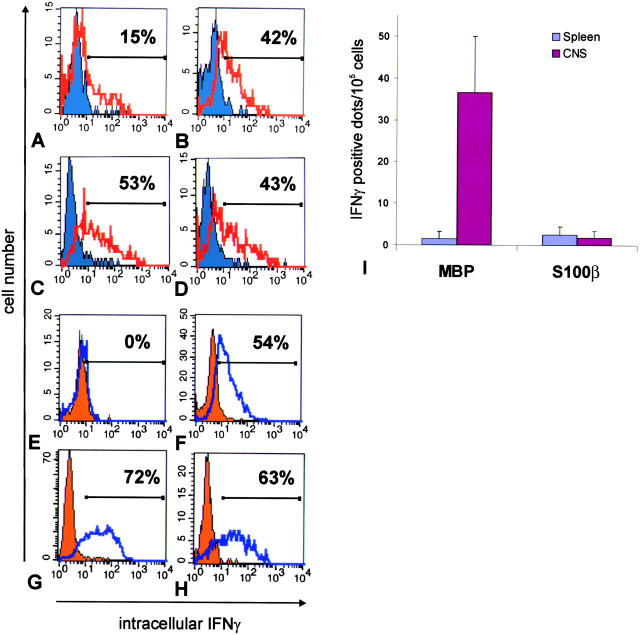
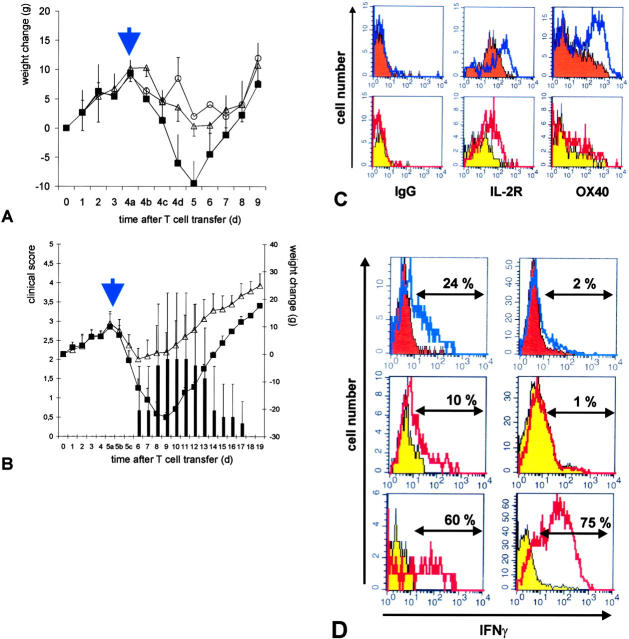
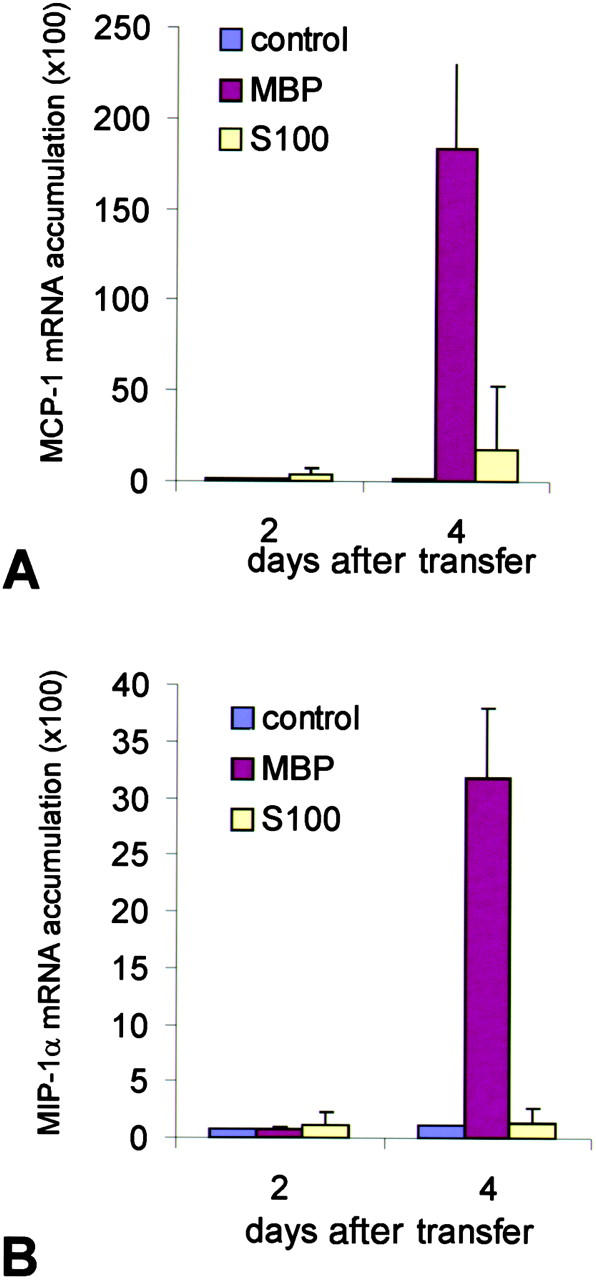
The clinical picture of experimental autoimmune encephalomyelitis (EAE) is critically dependent on the nature of the target autoantigen and the genetic background of the experimental animals. Potentially lethal EAE is mediated by myelin basic protein (MBP)-specific T cells in Lewis rats, whereas transfer of S100beta- or myelin oligodendrocyte glycoprotein (MOG)-specific T cells causes intense inflammatory response in the central nervous system (CNS) with minimal disease. However, in Dark Agouti rats, the pathogenicity of MOG-specific T cells resembles the one of MBP-specific T cells in the Lewis rat. Using retrovirally transduced green fluorescent T cells, we now report that differential disease activity reflects different levels of autoreactive effector T cell activation in their target tissue. Irrespective of their pathogenicity, the migratory activity, gene expression patterns, and immigration of green fluorescent protein(+) T cells into the CNS were similar. However, exclusively highly pathogenic T cells were significantly reactivated within the CNS. Without local effector T cell activation, production of monocyte chemoattractants was insufficient to initiate and propagate a full inflammatory response. Low-level reactivation of weakly pathogenic T cells was not due to anergy because these cells could be activated by specific antigen in situ as well as after isolation ex vivo.


Figures

Figure 1.
Figure 1.
Relative numbers of TGFP cells infiltrating the CNS in the course of tEAE. The number of CNS-infiltrating GFP-positive T cells in the CD4+ cell population was analyzed 4 d after transfer. TMBP-GFP (A), TDA-MOG-GFP (B), TS100β-GFP (C), and TLE-MOG-GFP (D) cells are shown. The majority of CD4+ T cells were GFP positive in all cell lines tested. Representative data of at least three independent experiments/TCLs are shown.
Figure 2.
Figure 2.
Infiltration of W3/13+ and ED1+ cells in the course of tEAE induced by TMBP-GFP, TS100β-GFP, TDA-MOG-GFP, and TLE-MOG-GFP cells. Lesions in the lumbosacral spinal cord 4 d after transfer of TMBP-GFP (A and E), TS100β-GFP (B and F), TDA-MOG-GFP (C and G), and TLE-MOG-GFP (D and H) cells mediated by tEAE are shown. TGFP cells (green), immunohistochemical staining with T cell marker W3/13 (A–D, red), and monocyte/macrophage marker ED1 (E–H, red). (Arrowheads) Location of TGFP cells (A–D) and monocytes/macrophages (E–H). Magnification bars, 10 μm. TGFP cells of all specificities infiltrate the CNS in high numbers at the onset of clinical symptoms. They can be found as well in the meningeal and perivascular areas as deep as the CNS parenchyma (A–H). ED-1–positive macrophages in TMBP-GFP and TDA-MOG-GFP cell–tEAE enter the CNS in high numbers where they are distributed throughout the tissue (E and G). In contrast, TS100β-GFP and TLE-MOG-GFP cells recruit less ED1+ monocytes/macrophages, which are mainly restricted to the meningeal and perivascular areas (F and H). Representative histological sections of lumbo-sacral spinal cords of at least two independent experiments/TCLs are shown.
Figure 3.
Figure 3.
Weakly pathogenic TGFP cells show minimal reactivation after infiltrating the target organ. 84 h after transfer of TMBP-GFP, TDA-MOG-GFP, TS100β-GFP, and TLE-MOG-GFP cells, the spinal cords and spleens of recipient rats were prepared. TGFP cells were analyzed cytofluorometrically for the expression of the surface membrane molecules OX-40 antigen (OX-40), IL-2R, and CD4. (IgG) Isotype control. Shaded histograms represent spleen-derived TGFP cells, and unshaded overlay histograms show TGFP cells isolated simultaneously from the CNS. Spinal cord–derived TMBP-GFP cells (blue histograms) and TDA-MOG-GFP cells (black histograms), but not TS100β-GFP cells (red histograms) and TLE-MOG-GFP cells (yellow histograms), up-regulate OX-40 antigen and IL-2R. Representative data of at least four independent experiments/TCLs are shown.
Figure 4.
Figure 4.
IFNγ, IL-10, and IL-2R mRNA of TGFP cells within the CNS. mRNAs of TMBP-GFP and TS100β-GFP cells from spleens (SPL) and spinal cords (CNS) 84 h after transfer and from parallel cultures (CUL) were quantitatively analyzed for the expression of IL-2, IFNγ, IL-10, and IL-2R. TMBP-GFP cells (blue columns), but not TS100β-GFP cells (orange columns), up-regulated the expression of IFNγ, IL-10, and IL-2R upon infiltration into the spinal cord. Specific copies of mRNA in relation to the housekeeping β-actin mRNA are shown. Ex vivo TGFP cells were obtained from three animals and measured in two independent quantitative PCR reactions.
Figure 5.
Figure 5.
IFNγ production of TGFP cells within the CNS. Intracellular staining for IFNγ of (A) TMBP-GFP cells isolated from spleens (blue shaded histogram) and spinal cords (unshaded red overlaid histogram) and (E) TS100β-GFP cells isolated from spleens (orange shaded histogram) and spinal cords (unshaded blue overlaid histogram) 4 d after transfer. For control, resting (shaded histograms) and blast T cells (unshaded overlaid histograms, 24 h after restimulation with specific antigen) of (B) TMBP-GFP cells and (F) TS100β-GFP cells were stained. Both TMBP-GFP cells (42%) and TS100β-GFP cells (54%) up-regulated IFNγ expression in vitro upon stimulation with specific antigen (B and F). However, exclusively TMBP-GFP cells produced IFNγ upon infiltration into the spinal cord (A, 15%). (C, D, G, and H) TMBP-GFP and TS100β-GFP cells isolated from spleens (C, TMBP-GFP cells, 53%; G, TS100β-GFP cells, 72%) and spinal cords (D, TMBP-GFP cells, 43%; H, TS100β-GFP cells, 63%) could be stimulated to produce IFNγ in the presence of PMA/ionomycin. (Shaded histograms) Nonstimulated ex vivo TGFP cells. (Overlaid open histograms) PMA/ionomycin-stimulated ex vivo TGFP cells. (I) (IFNγ–ELISPOT) Spontaneous IFNγ release of TMBP-GFP cells (MBP) and TS100β-GFP cells (S100β) isolated from spleens (blue bars) and spinal cords (pink bars) was determined after 24 h of culture. The values represent means of quadruplicate measurements involving four (MBP-tEAE) and nine (S100β-tEAE) animals, respectively. IFNγ-positive dots per 100,000 sorted cells were determined. Both TMBP-GFP cells and TS100β-GFP cells isolated from spleens and spinal cords could be stimulated to produce IFNγ in the presence of PMA/ionomycin (not depicted).
Figure 6.
Figure 6.
Intrathecal injection of antigen activates weakly pathogenic TGFP cells and aggravates clinical disease. Intrathecal injection of 20 μg of specific antigen (A, S100β; B, MOG, closed squares and black bars) or 20 μg of control antigen (OVA, open triangles) was performed at day 4 (A, S100β-EAE) or day 5 (B, LE-MOG-EAE) after T cell transfer. Control animals, which did not receive intrathecal injection, are shown (black circles). Weight loss was monitored daily, at day 4 (A) or 5 (B) in closer time intervals (4/5a: 1 h before; 4/5b: 4 h after; and 4/5c: 8 h after intrathecal S100β/MOG injection). Animals that had received 20 μg of specific antigen intrathecally showed enhanced weight loss starting 8 h after antigen injection. Animals of TLE-MOG-GFP cell–induced EAE developed clinical symptoms reaching maximal scores of three (B, black bars). Mean value and standard deviation of five independent experiments (S100β) and three independent experiments (MOG) are shown, including eight animals/treatment group. (C) TS100β-GFP (orange histograms) or TLE-MOG-GFP cells (yellow histograms) were isolated from spinal cords of control antigen (shaded histograms, 20 μg OVA) or specific antigen (overlay histograms, 20 μg S100β or MOG, respectively)–treated animals 4 h after intrathecal injection, and were analyzed cytofluorometrically for the expression of IL-2R and OX-40 antigen (OX-40). TGFP cells from specific antigen-treated but not OVA-treated animals up-regulated OX-40 antigen and IL-2R. (D) Intracellular IFNγ staining of TS100β-GFP (orange histograms) or TLE-MOG-GFP cells (yellow histograms) after intrathecal treatment with control antigen (shaded histograms, 20 μg OVA) or specific antigen (overlay histograms, 20 μg S100β or MOG, respectively). 4 h after intrathecal antigen injection TGFP cells in the CNS (top left histogram, TS100β-GFP cells, 24% of cells were IFNγ+; middle left histogram, TLE-MOG-GFP cells, 10% of cells were IFNγ+) but not in the spleen (top right histogram, TS100β-GFP cells, 2% of cells were IFNγ+; middle right histogram, TLE-MOG-GFP cells, 1% of cells were IFNγ+) up-regulated IFNγ production. Upon stimulation with PMA/ionomycin (unshaded overlay histograms), a high percentage of TLE-MOG-GFP cells isolated from CNS (bottom left histogram), and spleen (bottom right histogram) produced IFNγ. Representative results of two independent sets of experiments/antigen are shown.
Figure 7.
Figure 7.
Quantitative chemokine mRNA expression in the CNS. The relative amount of mRNA transcripts for (A) MCP-1 and (B) MIP-1α was analyzed from spinal cord tissue of MBP-EAE (MBP), S100β-EAE (S100), and control animals (control) by dot blot hybridization at days 2 and 4 after transfer. Note the massive up-regulation of MCP-1 and MIP-1α mRNA in the CNS of TMBP cell–treated, but not in the TS100β cell–treated, animals. Amplification of β-tubulin and analysis on ethidium bromide–stained agarose gels demonstrated intact RNA in all samples (not depicted). The data were confirmed in a second set of independently prepared samples.

Similar articles

Cited by

References

    1. Wekerle, H., K. Kojima, J. Lannes-Vieira, H. Lassmann, and C. Linington. 1994. Animal models. Ann. Neurol. 36:S47–S53. - PubMed
    1. Ben-Nun, A., H. Wekerle, and I.R. Cohen. 1981. The rapid isolation of clonable antigen-specific T lymphocyte lines capable of mediating autoimmune encephalomyelitis. Eur. J. Immunol. 11:195–199. - PubMed
    1. Benveniste, E.N. 1997. Role of macrophages/microglia in multiple sclerosis and experimental allergic encephalomyelitis. J. Mol. Med. 75:165–173. - PubMed
    1. Kojima, K., H. Wekerle, H. Lassmann, T. Berger, and C. Linington. 1997. Induction of experimental autoimmune encephalomyelitis by CD4+ T cells specific for an astrocyte protein, S100β. J. Neural Transm. 49(Suppl.):43–51. - PubMed
    1. Linington, C., T. Berger, L. Perry, S. Weerth, D. Hinze-Selch, Y. Zhang, H.-C. Lu, H. Lassmann, and H. Wekerle. 1993. T cells specific for the myelin oligodendrocyte glycoprotein (MOG) mediate an unusual autoimmune inflammatory response in the central nervous system. Eur. J. Immunol. 23:1364–1372. - PubMed

Publication types