. 2004 Jan 19;164(2):175-84.
doi: 10.1083/jcb.200307056.

FoxO3a regulates erythroid differentiation and induces BTG1, an activator of protein arginine methyl transferase 1

Affiliations

FoxO3a regulates erythroid differentiation and induces BTG1, an activator of protein arginine methyl transferase 1

Walbert J Bakker et al. J Cell Biol. .

Abstract

Erythropoiesis requires tight control of expansion, maturation, and survival of erythroid progenitors. Because activation of phosphatidylinositol-3-kinase (PI3K) is required for erythropoietin/stem cell factor-induced expansion of erythroid progenitors, we examined the role of the PI3K-controlled Forkhead box, class O (FoxO) subfamily of Forkhead transcription factors. FoxO3a expression and nuclear accumulation increased during erythroid differentiation, whereas untimely induction of FoxO3a activity accelerated differentiation of erythroid progenitors to erythrocytes. We identified B cell translocation gene 1 (BTG1)/antiproliferative protein 2 as a FoxO3a target gene in erythroid progenitors. Promoter studies indicated BTG1 as a direct target of FoxO3a. Expression of BTG1 in primary mouse bone marrow cells blocked the outgrowth of erythroid colonies, which required a domain of BTG1 that binds protein arginine methyl transferase 1. During erythroid differentiation, increased arginine methylation coincided with BTG1 expression. Concordantly, inhibition of methyl transferase activity blocked erythroid maturation without affecting expansion of progenitor cells. We propose FoxO3a-controlled expression of BTG1 and subsequent regulation of protein arginine methyl transferase activity as a novel mechanism controlling erythroid expansion and differentiation.


Figures

Figure 1.
Figure 1.
FoxO3a expression and activity increases during erythroid differentiation. (A) Western blots of differentiating I/11 cells (samples taken every 12 h) were analyzed with antibodies recognizing FoxO1a, FoxO3a, and FoxO4. ERK protein levels do not change during differentiation (loading control). (B) Western blot analysis of FoxO3a total protein levels during the first 24 h of differentiation (ERK expression serves as loading control). (C) I/11 cells were factor deprived and stimulated with 5 U/ml Epo and 1 μg/ml SCF for increasing time periods as indicated. Blots were analyzed with phosphospecific FoxO3a antibodies (S253) and antibodies recognizing total FoxO3a. An unidentified, cross-hybridizing protein (X) is dephosphorylated in response to Epo and SCF. Its signal is comparable at time 0 in the Epo and SCF panel when equally exposed. (D) Western blots of differentiating I/11 cells (samples taken every 12 h) were analyzed with antibodies recognizing FoxO3a and S253-phosphorylated FoxO3a, PKB and S473- phosphorylated PKB, and p27Kip and Erk. The protein recognized by phosphoSer253-FOXO3a antibodies at 72 h is unknown and may be the same background band X detected by this antibody in C. (E) Cytoplasmic and nuclear protein extracts of differentiating I/11 cells were analyzed with antibodies recognizing FoxO3a, STAT3, and ERK. Under these conditions, STAT3 is only present in the cytoplasm, indicating minimal contamination of nuclear extracts with cytoplasmic proteins. ERK expression serves as a loading control.
Figure 2.
Figure 2.
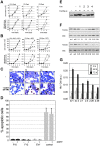
FoxO3a induces erythroid differentiation. All FoxO3a(A3):ER clones used had similar expression levels of the mutant FoxO3a protein, and treatment of all clones induced rapid up-regulation of p27Kip (not depicted). (A and B) A vector-transduced clone (EV1) and FoxO3a(A3):ER-expressing clones F5 and F6 were seeded in differentiation medium containing Epo (A) or Epo plus SCF (B), in the absence (open diamonds) or presence (closed squares) of 50 nM 4OHT. Cumulative cell numbers (top) and hemoglobin content per cell volume (bottom) were determined at daily intervals. (C) At day 4 of the experiments, cell morphology and hemoglobin content was analyzed in cytospins. Hemoglobinized cells can be discriminated by their orange-brown staining. (D) The vector control clone (EV1) and two FoxO3a(A3):ER clones (F10 and F12) were cultured in the presence of Epo, SCF, and Dex in the presence or absence of 4OHT. As a control, parental I/11 cells were seeded in medium lacking factors. After 24 h, the percentage of apoptotic cells was determined by a TUNEL assay. Values represent mean ± SD of apoptotic cells counted in five fields of a cytospin preparation (100 cells/field) in two independent experiments. (E) Phoenix E cells were transfected with FoxO3a wild type alone or in combination with RNAi constructs FOXi1–4 (see Materials and methods). Transient expression of FoxO3a was determined by Western blot (Erk serves as a loading control). (F) I/11 clones, transduced with pSuper-retro vector as a control (ev1 and ev2) or pSuper-retro FOXi2 (clone numbers indicated) were tested for FoxO3a on Western blot. (G) Two empty vector (ev1 and ev2) and four FOXi2 clones (clone numbers indicated) were differentiated in the presence of Epo. The hemoglobin content of the cells was measured at 0, 48, and 72 h in differentiation. Values represent mean ± SD of three experiments.
Figure 3.
Figure 3.
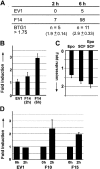
BTG1, a FoxO3a target gene. Labeled cDNA from FoxO3a(A3):ER clone F14 and vector clone EV1, exposed to 50 nM 4OHT for 0, 2, and 6 h in the presence of Epo, SCF, and Dex, were hybridized to a 9,000 cDNA microarray enriched for hematopoietic transcripts. (A) The number of spots that detected a >1.75-fold increase in signal upon treatment with 4OHT compared with nontreated cells is indicated for both clones after 2 and 6 h of treatment. BTG1 was represented at least 11 times on these arrays, 5 of these BTG1 spots showed >1.75-fold up-regulation after 2-h induction with 4OHT. (B and C) The average regulation on the 11 BTG1 spots is calculated after 2 and 6 h of 4OHT treatment (B) and after 2 h of Epo, SCF, or Epo plus SCF induction of factor-deprived cells (C), 1 meaning no regulation. Error bars indicate SD. (D) Control clone EV1 and FoxO3a(A3):ER clones F10 and F15 were treated with 50 nM 4OHT for 2 h, and relative BTG1 expression was determined by real-time PCR, using expression of RNase inhibitor to normalize the values. Values represent mean ± SD of three independent experiments.
Figure 4.
Figure 4.
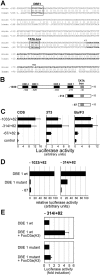
Regulation of BTG1 promoter activity by FoxO3a. (A) Sequence of the promoter region (plain) and part of the first exon (bold italics) of BTG1. Top sequence is derived from the mouse CELERA database and cDNA clone L16846, the bottom sequence is derived from the human BAC AC025164. The start of mouse cDNA L16846 was assigned as position+1. A potential TATA-box and FoxO-binding site (DBE1) are indicated. (B) Schematic drawing of the BTG1 promoter fragments used in reporter assays. Four potential FoxO-binding sites, DBE1–4, were found in the −1033/+82 promoter fragment. (C) Basal BTG1 promoter activity of these fragments was tested in COS, NIH3T3, and Ba/F3 cells and compared with a vector control (pGL3). Luciferase activity is represented as arbitrary units. Values represent mean ± SD of three measurements. (D) Both −1033/+82 and −314/+82 fragments with either a wild-type or a mutated DBE1 were tested for basal promoter activity in COS cells. The −67/+82 fragment serves as a negative control. (E) COS cells were cotransfected with FoxO3a(A3) and the −314/+82 BTG1 promoter with either a wild-type or a mutated DBE1. Luciferase activity is presented as fold induction on the horizontal axis. Values represent mean ± SD of three measurements.
Figure 5.
Figure 5.
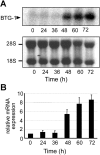
BTG1 is transcriptionally up-regulated during erythroid differentiation. (A) Total RNA was isolated from differentiating erythroid progenitors at 12-h intervals. BTG1 transcript levels were detected using a SmaI–BamHI 211-bp fragment as a probe (top). Ethidium bromide staining (bottom) indicated equal loading. (B) Real-time PCR on the RNA samples confirmed the kinetics in a quantitative way, using SYBR green in Taqman analysis and normalizing to the expression of the RNase inhibitor RI. Values represent mean ± SD of three measurements.
Figure 6.
Figure 6.
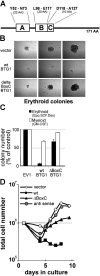
BTG1 inhibits proliferation of erythroid progenitors. (A) Schematic drawing of the 171–amino acid BTG1 protein, indicating the conserved domains A–C. (B–D) Density-purified murine bone marrow progenitors were transduced with an empty vector and retroviral expression vectors encoding BTG1 or BTG1 (ΔBoxC). Transduced cells were selected with puromycin in serum-free semisolid medium supplemented with 2 U/ml Epo, 100 ng/ml SCF, and 10−6 M Dex or with 10 ng/ml GM-CSF. Cytospins showed that all colonies grown with Epo, SCF, and Dex contain erythroid cells, whereas GM-CSF allows colony formation by various myeloid progenitors (not depicted). 7 d after plating, the morphology of erythroid colonies was photographed with a CCD camera (B, left to right: smallest, average, and largest colony) and colonies were counted (C). Values represent mean ± SD of three independent experiments each counted in triplo. Transduced cells were also grown in suspension cultures under conditions favoring expansion of erythroid progenitors, and total cell numbers were determined daily. An antisense BTG1 construct is added as a control (D).
Figure 7.
Figure 7.
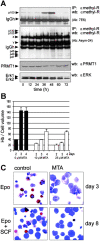
Protein methylation is associated with differentiation but not with renewal of erythroid progenitors. (A) Arginine-methylated proteins were immunoprecipitated and stained with two anti–methyl-arginine antibodies (E76 and ASYM24) from cell lysates taken at 12-h intervals during differentiation of I/11 cells. The size of specific proteins is indicated in kilodaltons. X and Y represent uncharacterized proteins detected by ASYM24 at all stages of differentiation. The bottom panels represent whole cell extract probed for total levels of PRMT1 and ERK (loading control). (B) During differentiation of I/11 cells in the presence of Epo and in the absence or presence of MTA (10 and 25 mM), hemoglobin accumulation was quantified at days 2–4. Hemoglobin per cell volume is measured in arbitrary units. Values represent mean ± SD of three measurements. (C) I/11 cells were seeded in differentiation medium in the presence of Epo (top) or Epo plus SCF (bottom), in the absence (left) or presence (right) of the methyl-transferase inhibitor MTA (25 mM). At day 3 (Epo) or day 8 (Epo/SCF), cell morphology was analyzed in cytospins stained for hemoglobin (hemoglobinized cells stain orange/brown) and histological dyes. In the presence of MTA, cells retained a blast morphology and failed to accumulate hemoglobin.

Similar articles

Cited by

References

    1. Bao, H., S.M. Jacobs-Helber, A.E. Lawson, K. Penta, A. Wickrema, and S.T. Sawyer. 1999. Protein kinase B (c-Akt), phosphatidylinositol 3-kinase, and STAT5 are activated by erythropoietin (EPO) in HCD57 erythroid cells but are constitutively active in an EPO-independent, apoptosis-resistant subclone (HCD57-SREI cells). Blood. 93:3757–3773. - PubMed
    1. Berthet, C., F. Guehenneux, V. Revol, C. Samarut, A. Lukaszewicz, C. Dehay, C. Dumontet, J.P. Magaud, and J.P. Rouault. 2002. Interaction of PRMT1 with BTG/TOB proteins in cell signalling: molecular analysis and functional aspects. Genes Cells. 7:29–39. - PubMed
    1. Beug, H., S. Palmieri, C. Freudenstein, H. Zentgraf, and T. Graf. 1982. Hormone-dependent terminal differentiation in vitro of chicken erythroleukemia cells transformed by ts mutants of avian erythroblastosis virus. Cell. 28:907–919. - PubMed
    1. Bogdan, J.A., C. Adams-Burton, D.L. Pedicord, D.A. Sukovich, P.A. Benfield, M.H. Corjay, J.K. Stoltenborg, and I.B. Dicker. 1998. Human carbon catabolite repressor protein (CCR4)-associative factor 1: cloning, expression and characterization of its interaction with the B-cell translocation protein BTG1. Biochem. J. 336:471–481. - PMC - PubMed
    1. Bradbury, A., R. Possenti, E.M. Shooter, and F. Tirone. 1991. Molecular cloning of PC3, a putatively secreted protein whose mRNA is induced by nerve growth factor and depolarization. Proc. Natl. Acad. Sci. USA. 88:3353–3357. - PMC - PubMed

Publication types

MeSH terms