. 2004 Feb 3;101(5):1200-5.
doi: 10.1073/pnas.0306490101. Epub 2004 Jan 20.

A genomewide oscillation in transcription gates DNA replication and cell cycle

Affiliations

A genomewide oscillation in transcription gates DNA replication and cell cycle

Robert R Klevecz et al. Proc Natl Acad Sci U S A. .

Abstract

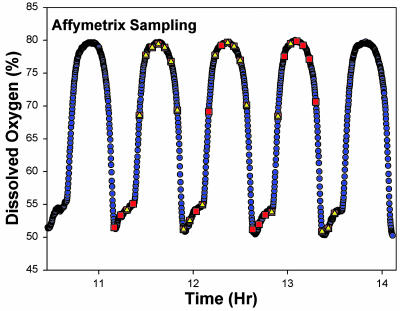
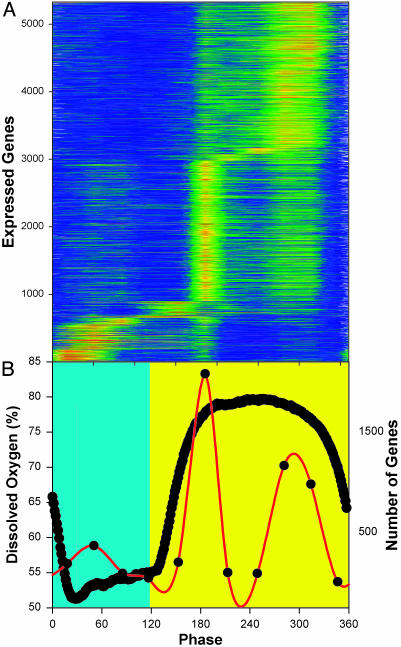
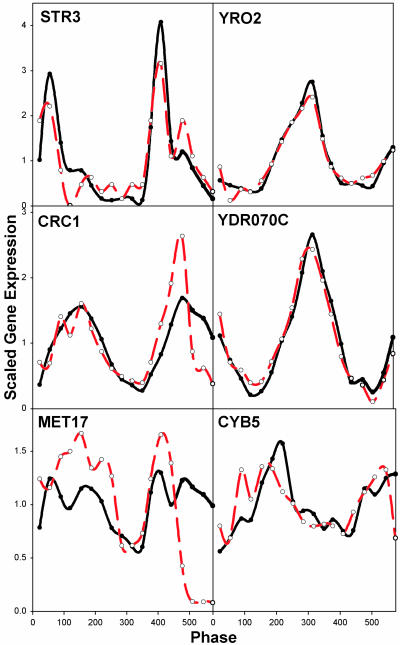
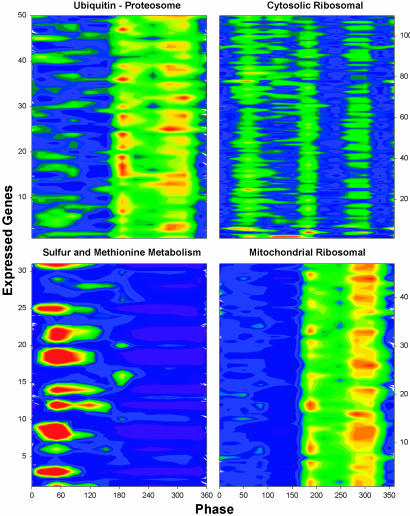
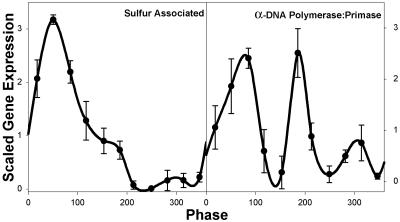
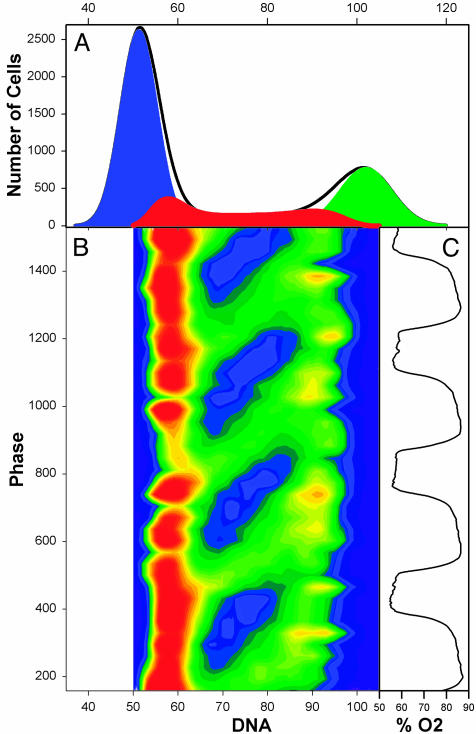
Microarray analysis from a yeast continuous synchrony culture system shows a genomewide oscillation in transcription. Maximums in transcript levels occur at three nearly equally spaced intervals in this approximately 40-min cycle of respiration and reduction. Two temporal clusters (4,679 of 5,329) are maximally expressed during the reductive phase of the cycle, whereas a third cluster (650) is maximally expressed during the respiratory phase. Transcription is organized functionally into redox-state superclusters with genes known to be important in respiration or reduction being synthesized in opposite phases of the cycle. The transcriptional cycle gates synchronous bursts in DNA replication in a constant fraction of the population at 40-min intervals. Restriction of DNA synthesis to the reductive phase of the cycle may be an evolutionarily important mechanism for reducing oxidative damage to DNA during replication.


Figures

Fig. 1.
Fig. 1.
Sampling for expression microarray analysis from continuous synchrony cultures. Respiratory-reductive synchrony is monitored by using DO levels in the media of aerobic continuous cultures. The sample times are shown imposed on the DO oscillation. High DO levels are associated with the reductive phase and low DO levels with the respiratory phase of the cycle. Samples were taken at 4-min intervals through three complete cycles each from two independent cultures. A total of 68 RNA samples were isolated and analyzed. All RNA samples were analyzed for quality by using an Agilent Bioanalyzer capillary electrophoresis system. Thirty-two samples were selected from the best RNA profiles and aligned based solely on their phase position on the DO curve, before Affymetrix expression analysis. Sampling for flow cytometry is shown as red squares and for RNA as yellow triangles.
Fig. 2.
Fig. 2.
Average expression levels from three cycles of the respiratory oscillation. Color contour (intensity) maps of the expression levels of the 5,329 expressed genes are shown for all 32 RNA samples through three cycles of the DO oscillation. (A) The average expression level for the three biological replicates are shown. High levels of expression are orange, and low levels are blue. Genes were scored as present based on the Affymetrix default settings and included in the analysis if at least 1 of the 32 was scored as present in each of the three cycles. Genes are defined according to the most recent assignments (23). Values shown here were scaled by dividing the average expression level for each gene into each of the time-series samples for that gene. Transcripts were ordered according to their phase of maximum expression in the average of the three replicates. This same scaling and ordering was used in Fig. 7. Samples are identified according to their phase in the cycle (0–360°/cycle). Sample phases are shown in reference to the DO curve (thick black line, B). The reductive phase is taken to be the period of minimal oxygen consumption (maximum DO, yellow background) in the interval between the minimum DO levels, and the respiratory phase is shown against a blue-green background. (B) Summary of the results for the time of maximum expression (red line) for the transcripts of A. Color scale: orange-red =>1.6 and dark blue = <0.8.
Fig. 3.
Fig. 3.
Comparison of Affymetrix microchip data with Northern blots. Northern blot analyses of transcripts found to be maximally expressed at differing points in the redox/transcriptional cycle were compared with the results from the microarray analyses. Six clones of representative genes were examined in 18 time-series samples representing 1.5 cycles of the DO oscillation and were scaled by dividing each time point by the average of all of the points. Red lines indicate Northern blot data, and black lines indicate Affymetrix intensity data.
Fig. 4.
Fig. 4.
Temporal organization of functionally related transcripts. Subsets of functionally related transcripts were color-mapped as in Fig. 1 to show the time of expression maximums as described above. The files used to generate these color maps are available Table 1. For sulfur metabolism transcripts (Lower Right) the scale is orange-red = >2.2 and dark blue = <0.8. For all other panels, orange-red = >1.4 and dark blue = <0.8.
Fig. 5.
Fig. 5.
Cycle-to-cycle reproducibility in selected functional groupings. Subtracting the minimum expression and scaling the result to an average of 1 determines the change in average intensity for each gene. (Left) Six sulfur-associated genes (see Table 1) were averaged, and the SD was determined. (Right) The genes for the four subunits of the α DNA polymerase/primase complex were averaged, and the SD was determined. The error bars represent 1 SD.
Fig. 6.
Fig. 6.
Flow cytometric analysis of S-phase gating in the reductive phase of the cycle. The 1D frequency histogram (A) showing DNA content of the population for 39 samples taken at 4-min intervals have been stacked (B) in relationship to the time in the DO oscillation at which they were sampled (C) and color-mapped to show numbers of cells in early, middle, and late S phase (B). In the resulting 2D color map, with red indicating more cells and blue representing fewer cells, the track of cells through S phase appears as a series of green bands moving left to right and upward on the diagonal. Red = 350 cells, light green = 200 cells, and dark blue = 0 cells.

Comment in

Similar articles

Cited by

References

    1. Klevecz, R. R. & Ruddle, F. H. (1968) Science 159, 634–636. - PubMed
    1. Kauffman, S. A. & Wille, J. J. (1975) J. Theor. Biol. 55, 47–93. - PubMed
    1. Mackey, M. C. & Glass, L. (1977) Science 197, 287–289. - PubMed
    1. Waddington, C. D. (1957) The Strategy of the Gene (Allen and Unwin, London)
    1. Eigen, M. & Schuster, P. (1977) Naturwissenschaften 64, 541–565. - PubMed

Publication types