Comparative Study
. 2004 Mar;25(4):573-86.
doi: 10.1002/jcc.10405.

A hydration study of (1-->4) and (1-->6) linked alpha-glucans by comparative 10 ns molecular dynamics simulations and 500-MHz NMR

Affiliations
Comparative Study

A hydration study of (1-->4) and (1-->6) linked alpha-glucans by comparative 10 ns molecular dynamics simulations and 500-MHz NMR

Francisco Corzana et al. J Comput Chem. 2004 Mar.

Abstract

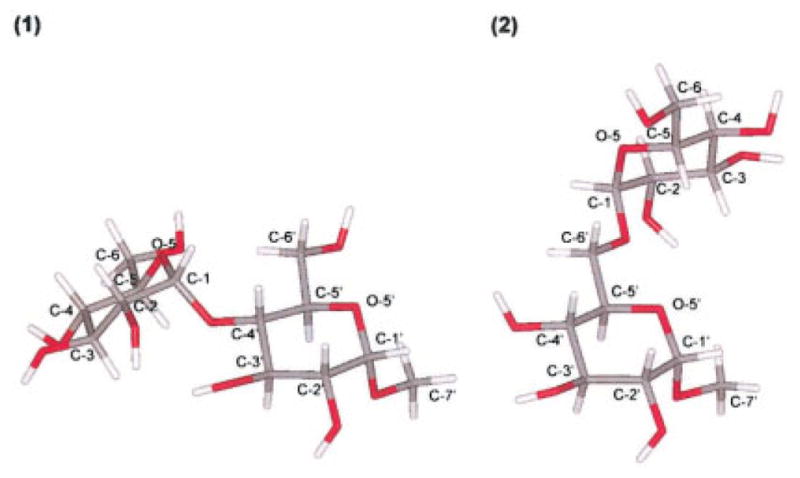
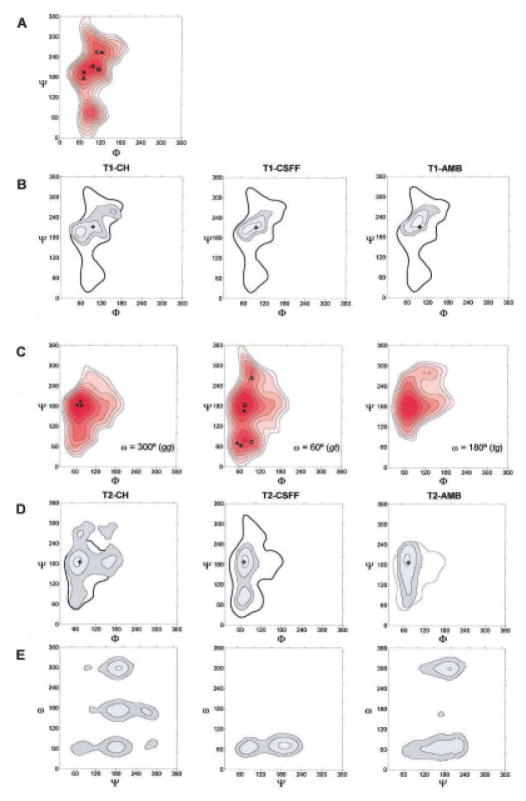
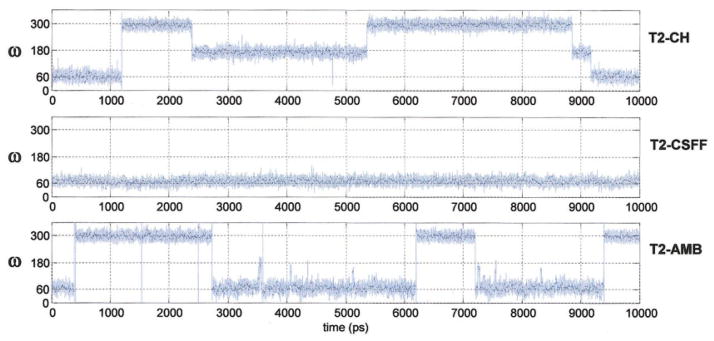
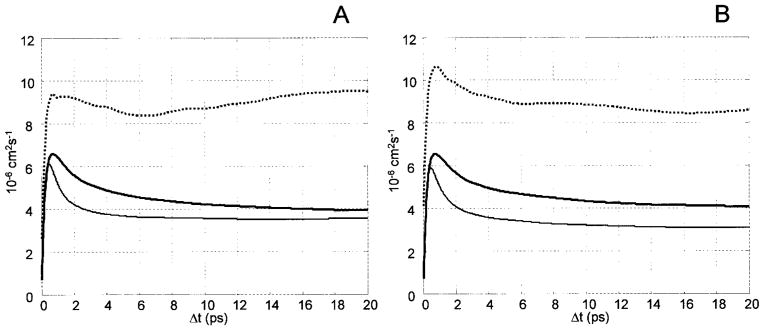
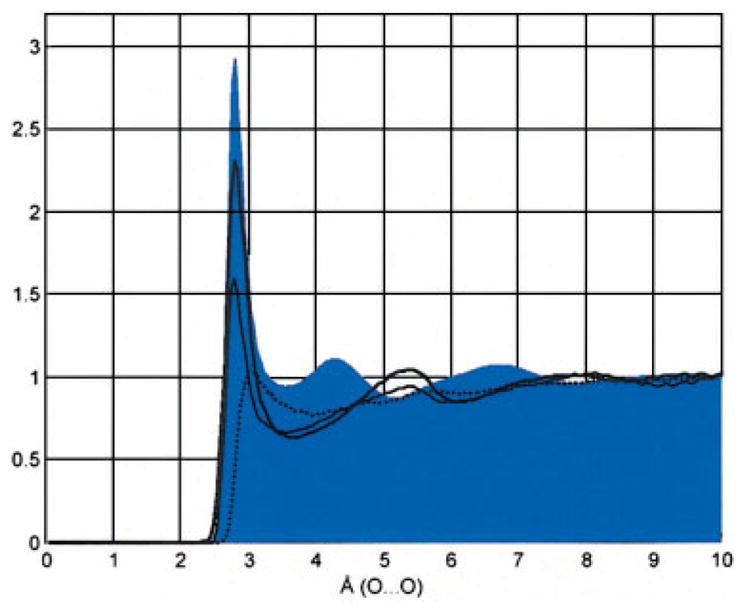
The hydration behavior of two model disaccharides, methyl-alpha-D-maltoside (1) and methyl-alpha-D-isomaltoside (2), has been investigated by a comparative 10 ns molecular dynamics study. The detailed hydration of the two disaccharides was described using three force fields especially developed for modeling of carbohydrates in explicit solvent. To validate the theoretical results the two compounds were synthesized and subjected to 500 MHz NMR spectroscopy, including pulsed field gradient diffusion measurements (1: 4.0. 10(-6) cm(2). s(-1); 2: 4.2. 10(-6) cm(2). s(-1)). In short, the older CHARMM-based force field exhibited a more structured carbohydrate-water interaction leading to better agreement with the diffusional properties of the two compounds, whereas especially the alpha-(1-->6) linkage and the primary hydroxyl groups were inaccurately modeled. In contrast, the new generation of the CHARMM-based force field (CSFF) and the most recent version of the AMBER-based force field (GLYCAM-2000a) exhibited less structured carbohydrate-water interactions with the result that the diffusional properties of the two disaccharides were underestimated, whereas the simulations of the alpha-(1-->6) linkage and the primary hydroxyl groups were significantly improved and in excellent agreement with homo- and heteronuclear coupling constants. The difference between the two classes of force field (more structured and less structured carbohydrate-water interaction) was underlined by calculation of the isotropic hydration as calculated by radial pair distributions. At one extreme, the radial O em leader O pair distribution function yielded a peak density of 2.3 times the bulk density in the first hydration shell when using the older CHARMM force field, whereas the maximum density observed in the GLYCAM force field was calculated to be 1.0, at the other extreme.


Figures

Figure 1
Figure 1
Molecular structure of compounds 1 and 2 including atomic labels. (1) methyl-α-D-maltoside, and (2) methyl-α-D-isomaltoside.
Figure 2
Figure 2
Population density maps and MM3-generated relaxed-residue steric energy maps. (A) The adiabatic map of α-maltose as a function of Φ and Ψ. Isoenergy contours are drawn at 1 kcal · mol−1 increments to 8 kcal · mol−1 above the global minimum. (B) Population density maps of methyl-α-D-maltoside in aqueous solution as a function of Φ and Ψ calculated from the three trajectories. Contours are drawn at (0.1, 0.01, 0.001, and 0.0001) population levels. All three figures have been superimposed on the outer contour of the MM3 energy maps of α-maltose. (C) Adiabatic maps of α-isomaltose as a function of Φ and Ψ and three staggered ω conformations. Isoenergy contours are drawn at 1 kcal · mol−1 increments to 8 kcal · mol−1 above the global minimum. (D) Population density maps of methyl-α-D-isomaltoside in aqueous solution as a function of Φ and Ψ calculated from the three trajectories. Contours are drawn at (0.1, 0.01, 0.001, and 0.0001) population levels. All three figures have been superimposed on the outer contour of the MM3 energy maps of α-isomaltose. (E) Population density maps of methyl-α-D-isomaltoside in aqueous solution as a function of Ψ and ω calculated from the three trajectories. Contours are drawn at (0.1, 0.01, 0.001, and 0.0001) population levels. All three figures have been superimposed on the outer contour of the corresponding MM3 energy maps. All figures include positions of the global minimum (+).
Figure 3
Figure 3
Time series monitoring the ω-dihedral in the 10 ns methyl-α-D-isomaltoside trajectories: T2–CH (HBFG), T2–CSFF (CSFF), and T2–AMB (GLYCAM-2000a). [Color figure can be viewed in the online issue, which is available at www.interscience.wiley.com.]
Figure 4
Figure 4
Calculated translational diffusion of (A) methyl-α-D-maltoside, and (B) methyl-α-D-isomaltoside. Thick line = HBFG, thin line =CSFF, and dotted line =GLYCAM-2000a.
Figure 5
Figure 5
Radial pair distribution function (RPD) of water and oxygen O-3 of methyl-α-D-maltoside. Thick line = HBFG, thin line = CSFF, and dotted line =GLYCAM-2000a. The gray background contour is the experimental Ow…Ow radial pair distribution of water. [Color figure can be viewed in the online issue, which is available at www.interscience.wiley.com.]
Figure 6
Figure 6
PCA on RPD of all oxygens of methyl-α-maltoside (■ black), methyl-α-isomaltoside (◆ black), trehalose (☆ blue), and sucrose (◆ red). [Color figure can be viewed in the online issue, which is available at www.interscience.wiley.com.]
Figure 7
Figure 7
Maximum shared water densities among (A) methyl-α-D-maltoside, and (B) methyl-α-D-isomaltoside oxygens as calculated by normalized 2D pair distribution functions at Os…Ow distance between 2.8–3.5 Å. Densities crossing the glycosidic linkages are indicated with dashed lines. Normal = CSFF, bold =HGFB, and italic =GLYCAM-2000a. [Color figure can be viewed in the online issue, which is available at www.interscience.wiley.com.]
Figure 8
Figure 8
Two-dimensional radial pair distribution functions of different bridging water situations of methyl-α-D-maltoside. Isocontours: 0.96, 1.2, 2.0, 3.0, 4.0, 5.0, 6.0, and 7.0 cal · mol−1. [Color figure can be viewed in the online issue, which is available at www.interscience.wiley.com.]

Similar articles

Cited by

References

    1. Brady JW. J Am Chem Soc. 1989;111:5155.
    1. Engelsen SB, Hervé du Penhoat C, Pérez S. J Phys Chem. 1995;99:13334.
    1. Kirschner KN, Woods RJ. Proc Natl Acad Sci USA. 2001;98:10541. - PMC - PubMed
    1. Engelsen SB, Monteiro C, Hervé du Penhoat C, Pérez S. Biophys Chem. 2001;93:103. - PubMed
    1. Di Bari M, Cavatorta F, Deriu A, Albanese G. Biophys J. 2001;81:1190. - PMC - PubMed

Publication types

LinkOut - more resources