. 2004 Jan;2(1):E9.
doi: 10.1371/journal.pbio.0020009. Epub 2003 Dec 15.

Similarities and differences in genome-wide expression data of six organisms

Affiliations

Similarities and differences in genome-wide expression data of six organisms

Sven Bergmann et al. PLoS Biol. 2004 Jan.

Abstract

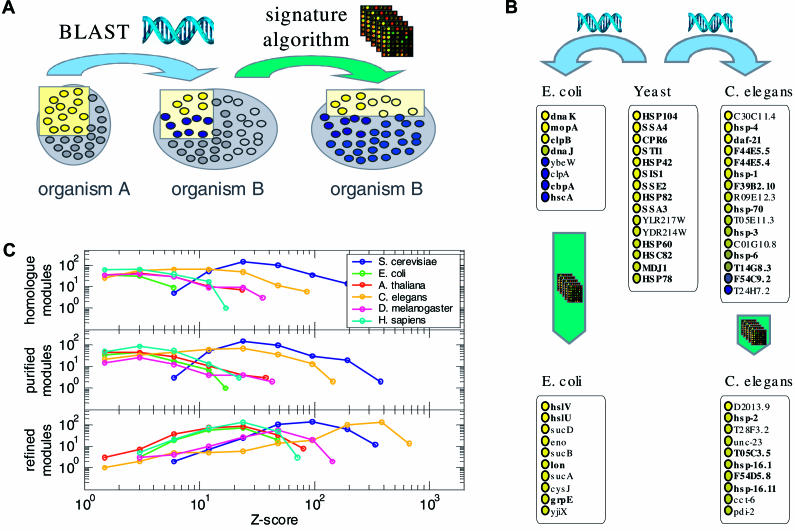
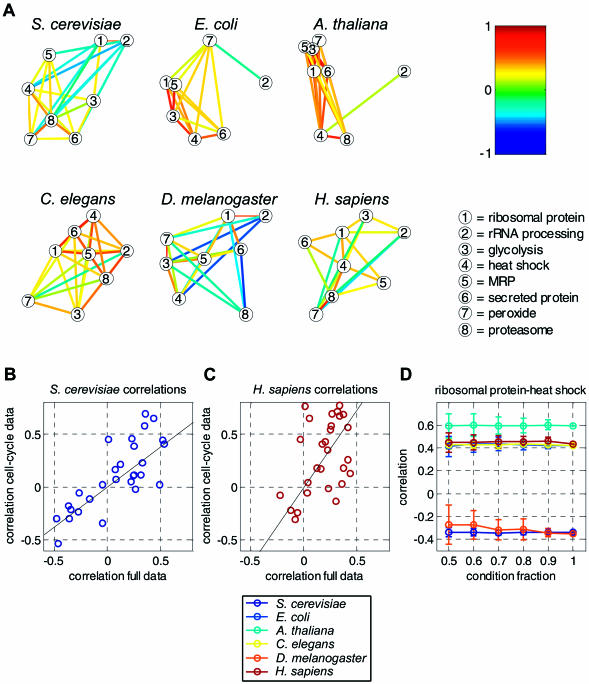
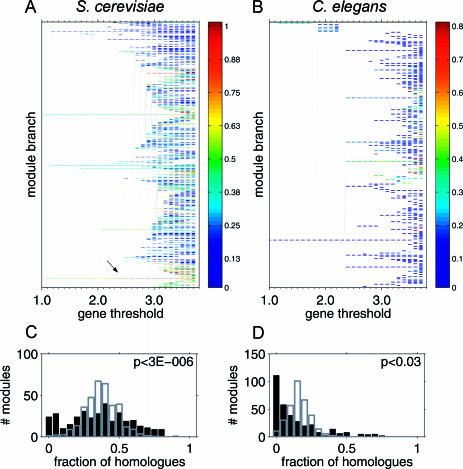
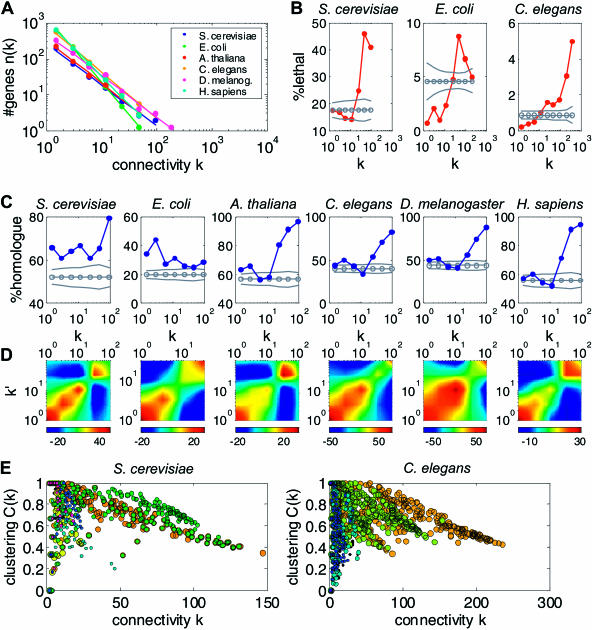
Comparing genomic properties of different organisms is of fundamental importance in the study of biological and evolutionary principles. Although differences among organisms are often attributed to differential gene expression, genome-wide comparative analysis thus far has been based primarily on genomic sequence information. We present a comparative study of large datasets of expression profiles from six evolutionarily distant organisms: S. cerevisiae, C. elegans, E. coli, A. thaliana, D. melanogaster, and H. sapiens. We use genomic sequence information to connect these data and compare global and modular properties of the transcription programs. Linking genes whose expression profiles are similar, we find that for all organisms the connectivity distribution follows a power-law, highly connected genes tend to be essential and conserved, and the expression program is highly modular. We reveal the modular structure by decomposing each set of expression data into coexpressed modules. Functionally related sets of genes are frequently coexpressed in multiple organisms. Yet their relative importance to the transcription program and their regulatory relationships vary among organisms. Our results demonstrate the potential of combining sequence and expression data for improving functional gene annotation and expanding our understanding of how gene expression and diversity evolved.


Conflict of interest statement

The authors have declared that no conflicts of interest exist.

Figures

Figure 1
Figure 1. Using Expression Data to Identify and Refine Sequence-Based Functional Assignments
(A) Starting from a set of coexpressed genes (yellow dots in left box) associated with a particular function in organism A, we first identify the homologues in organism B using BLAST (middle box). Only some of these homologues are coexpressed while others are not (blue dots). The signature algorithm selects this coexpressed subset and adds further genes (light yellow) that were not identified based on sequence, but share similar expression profiles (right box). (B) The 15 coexpressed genes associated with heat shock in yeast (center) have eight homologues in E. coli (left) and 14 in C. elegans (right). Among the ten genes whose expression profiles are the most similar to these homologues (bottom), many are known to be associated with heat-shock response (boldface). (C) For each of the six organisms, the distribution of the Z-scores for the average gene–gene correlation of all the “homologue modules” (see Materials and Methods) obtained from the yeast modules is shown (top). Rejecting the homologues that are not coexpressed gives rise to the “purified modules,” whose Z-scores generally are larger (except for the yeast modules, which contain only coexpressed genes from the beginning). Adding further coexpressed genes yields the “refined modules,” which have significantly larger Z-scores (bottom).
Figure 2
Figure 2. Regulatory Relations between Modules
A selection of eight transcription modules whose function is known in yeast was used to generate the corresponding (refined) homologue modules in the other five organisms. Each module is associated with a “condition profile” generated by the signature algorithm based on the expression data. (A) Correlations between these profiles were calculated for all pairs of modules in each organism. Note that for E. coli there is no proteasome and that the mitochondrial ribosomal proteins (MRPs) correspond to ribosomal genes. Modules are represented by circles (legend). Significantly correlated or significantly anticorrelated modules are connected by colored lines indicating their correlation (color bar). Positively correlated modules are placed close to each other, while a large distance reflects anticorrelation. See Figure S11 for a numerical tabulation of all pairwise correlations. (B and C) Correlations between pairs of modules according to the cell-cycle data as a function their correlation in the full data. Each circle corresponds to a pair of S. cerevisiae modules (B) or human modules (C). (D) To check the sensitivity of our results with respect to the size of the dataset, we reevaluated the correlations between the sets of conditions for randomly selected subsets of the data. Shown are the mean and standard deviation of the correlation coefficient between the heat-shock and protein-synthesis modules as a function of the fraction of removed conditions (see Figures S4 and S5 for correlations between other module pairs).
Figure 3
Figure 3. Properties of Transcription Modules
(A and B) Module trees summarize the transcription modules identified by the ISA at different resolutions. Branches represent modules (rectangles) that remain fixed points over a range of thresholds. Fixed points that emerge at a higher threshold converge into an existing module when iterated at a lower threshold (thin transversal lines). Modules are colored according to the fraction of homologues they possess in the other organism (see the color bar). Among the yeast modules, those associated with protein synthesis (arrow) have the largest fraction of worm homologues. Searchable trees for all six organisms are available at http://barkai-serv.weizmann.ac.il/ComparativeAnalysis. (C) Histogram for the number of yeast modules with a given fraction of genes possessing a homologue in C. elegans (black bars). The distribution indicates that a significant number of modules have either much less or much more homologues than expected; indicated p-value were computed according to Kolmogorov–Smirnov test against control distribution (gray) generated from random sets of modules preserving their size. (D) Same as in (C) for C. elegans modules considering yeast homologues (see Figure S12 for other organisms).
Figure 4
Figure 4. Global Properties of Transcription Networks
(A) The number of genes n(k) with connectivity k is plotted as a function of k (see Materials and Methods). For each of the six organisms n(k) is distributed as a power-law, n(k)k −γ, with similar exponents γ ≈ 1.1–1.8 (see Figure S13). (B) The fraction of lethal genes is shown as a function of k for S. cerevisiae, E. coli, and C. elegans. The control (gray line) is obtained from 10,000 random choices for the lethal genes (preserving their total number). The dashed lines indicate standard deviations. (C) The fraction of genes with at least one yeast homologue is shown as a function of k for all six organisms. Control (gray) as in (B). (D) Z-score quantifying the deviation of the number of connections between genes with connectivities k and k′ from that expected by randomly rewired networks (see Maslov and Sneppen 2002). Note that connections between genes of similar connectivity are enhanced (red regions), while those between highly and weakly connected genes are suppressed (blue). (E) The clustering coefficient C is plotted against k. Each dot corresponds to a single gene and is colored according to the transcription module it is associated with (see also Figure 2). Note that genes associated with the same module correspond to a specific band in the kC plane. Several genes with high connectivity belong to more than one module (green dots superimposed on orange ones).

References

    1. Albert R, Barabasi A-L. Statistical mechanics of complex networks. Rev Mod Phys v. 2002;74:47–97.
    1. Alter O, Brown PO, Botstein D. Generalized singular value decomposition for comparative analysis of genome-scale expression data sets of two different organisms. Proc Natl Acad Sci U S A. 2003;100:3351–3356. - PMC - PubMed
    1. Altschul SF, Madden TL, Schaffer AA, Zhang J, Zhang Z, et al. Gapped BLAST and PSI-BLAST: A new generation of protein database search programs. Nucleic Acids Res. 1997;25:3389–3402. - PMC - PubMed
    1. Arbeitman MN, Furlong EE, Imam F, Johnson E, Null BH, et al. Gene expression during the life cycle of Drosophila melanogaster . Science. 2002;297:2270–2275. - PubMed
    1. Barbasi A-L, Albert R. Emergence of scaling in random networks. Science. 1999;286:509–512. - PubMed

Publication types

MeSH terms