. 2004 Jan;2(1):E24.
doi: 10.1371/journal.pbio.0020024. Epub 2004 Jan 20.

Long-lasting novelty-induced neuronal reverberation during slow-wave sleep in multiple forebrain areas

Affiliations

Long-lasting novelty-induced neuronal reverberation during slow-wave sleep in multiple forebrain areas

Sidarta Ribeiro et al. PLoS Biol. 2004 Jan.

Abstract

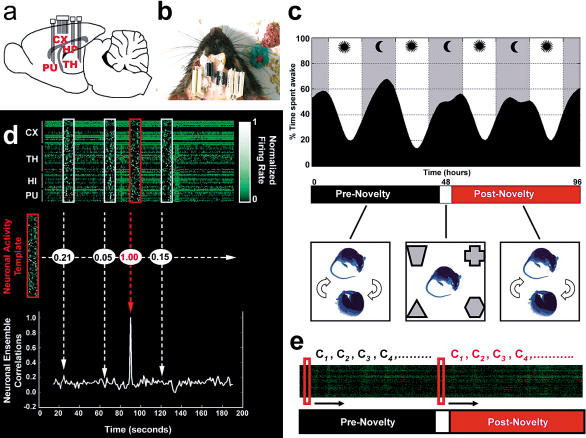
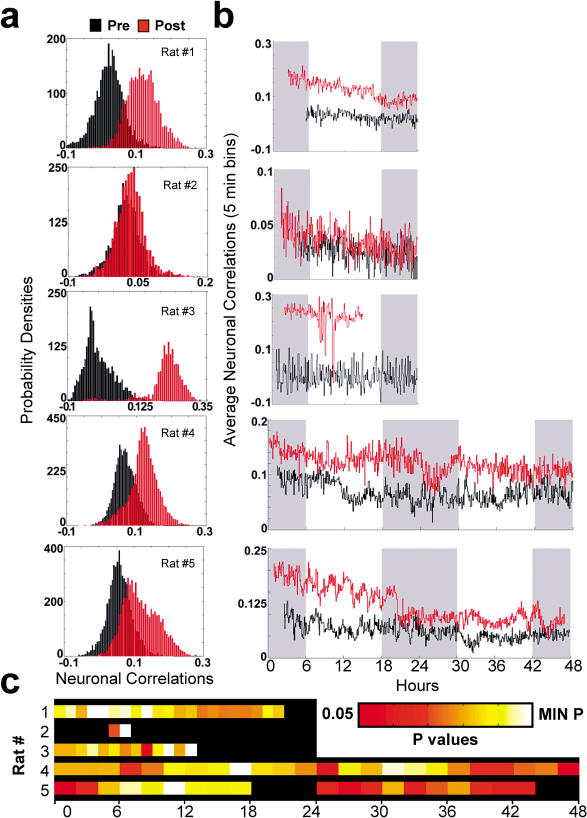
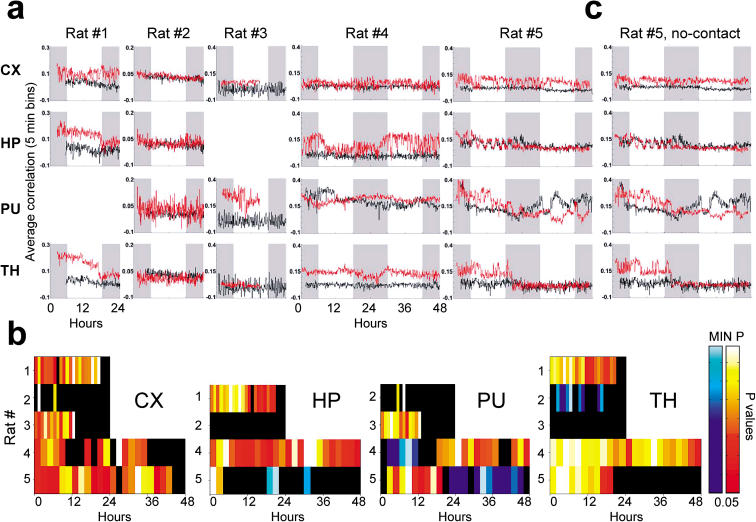
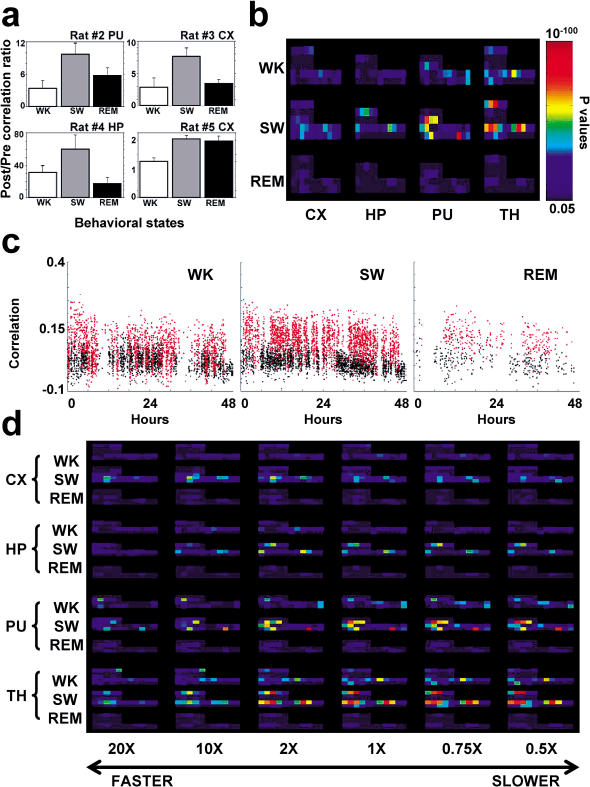
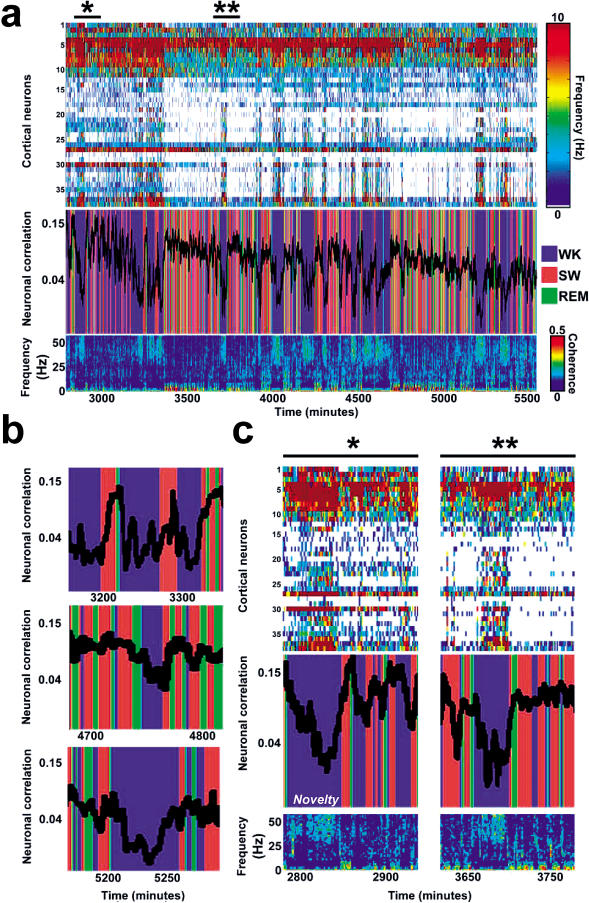
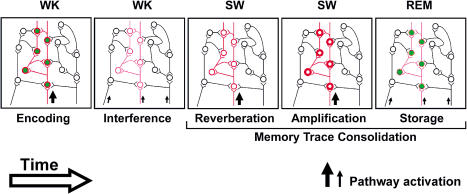
The discovery of experience-dependent brain reactivation during both slow-wave (SW) and rapid eye-movement (REM) sleep led to the notion that the consolidation of recently acquired memory traces requires neural replay during sleep. To date, however, several observations continue to undermine this hypothesis. To address some of these objections, we investigated the effects of a transient novel experience on the long-term evolution of ongoing neuronal activity in the rat forebrain. We observed that spatiotemporal patterns of neuronal ensemble activity originally produced by the tactile exploration of novel objects recurred for up to 48 h in the cerebral cortex, hippocampus, putamen, and thalamus. This novelty-induced recurrence was characterized by low but significant correlations values. Nearly identical results were found for neuronal activity sampled when animals were moving between objects without touching them. In contrast, negligible recurrence was observed for neuronal patterns obtained when animals explored a familiar environment. While the reverberation of past patterns of neuronal activity was strongest during SW sleep, waking was correlated with a decrease of neuronal reverberation. REM sleep showed more variable results across animals. In contrast with data from hippocampal place cells, we found no evidence of time compression or expansion of neuronal reverberation in any of the sampled forebrain areas. Our results indicate that persistent experience-dependent neuronal reverberation is a general property of multiple forebrain structures. It does not consist of an exact replay of previous activity, but instead it defines a mild and consistent bias towards salient neural ensemble firing patterns. These results are compatible with a slow and progressive process of memory consolidation, reflecting novelty-related neuronal ensemble relationships that seem to be context- rather than stimulus-specific. Based on our current and previous results, we propose that the two major phases of sleep play distinct and complementary roles in memory consolidation: pretranscriptional recall during SW sleep and transcriptional storage during REM sleep.


Conflict of interest statement

The authors have declared that no conflicts of interest exist.

Figures

Figure 1
Figure 1. Methodology
(A) Neuroanatomical location of multielectrode implants, indicated on a schematic parasaggital section based on Paxinos and Watson (1997). Indicated are the cerebral cortex (CX), the hippocampus (HP), the thalamus (TH), and the putamen (PU). (B) Top view of a rat implanted with several multielectrode arrays. (C) Experimental design. The upper panel shows a representative example of the strong circadian dynamics of the rat sleep–wake cycle (rat 5). Gray bands indicate lights-off; white bands indicate lights-on. Notice the fixed 12-h periods of darkness and light. The lower panels show animals continuously recorded for up to 96 h that were kept undisturbed except for a 1-h period of novel CSS (white segment) produced by the tactile exploration of four distinct novel objects placed at the corners of the recording box. Neural data from pre- and postnovelty periods (black and red segments, respectively, in the middle panel) were compared. (D) Neuronal ensemble correlation method. Neuronal activity templates (red boxes) were compared with extensive recordings of neuronal action potentials (green ticks in upper panel) by way of an offline template-matching algorithm (Louie and Wilson 2001) that generalizes the notion of pairwise correlations to neuronal ensembles of any size. Templates and targets (white boxes) were binned, firing-rate normalized, and correlated (middle panel). This procedure yields a time series of neuronal ensemble correlations for each template–target sliding match (lower panel). (E) Templates of interest (red boxes) were sampled around the origin of pre- and postnovelty periods during alert WK and slid against their corresponding neuronal targets so as to sample neuronal correlations every 30 s for up to 48 h.
Figure 2
Figure 2. Neuronal Ensemble Correlations Including up to Four Forebrain Regions Reveal Long-Lasting Reverberation
(A) Postnovelty neuronal correlations were significantly larger than prenovelty correlations in all animals studied. (B) Temporal profiles of neuronal ensemble correlations. Gray bands indicate lights-off; white bands indicate lights-on. (C) Temporal evolution of p values associated with pre- and postnovelty Bonferroni comparisons performed in intervals of 1 h (rats 1–3) or 2 h (rats 4 and 5). Significant experience-dependent neuronal reverberation was detected up to 48 h after novel stimulation. Color bar in linear scale; black denotes p > 0.05. The minimum p values (MIN P) were, respectively, 10−14, 10−3, 10−12, 10−23, and 10−22.
Figure 3
Figure 3. Long-Lasting Neuronal Reverberation Occurs in the CX, HP, PU, and TH
(A) Temporal profiles of neuronal ensemble correlations in all recording sites. Gray bands indicate lights-off; white bands indicate lights-on. Red and black traces indicate post- and prenovelty correlations, respectively. (B) Temporal evolution of p values associated with pre- and postnovelty Bonferroni comparisons for individual brain areas, calculated as in Figure 2C. Color bar in linear scale; black denotes p > 0.05. Minimum p values (MIN P) in crescent “rat number” order, as follows: CX: 10−10, 10−4, 10−5, 10−9, 10−9; HP: 10−12, not significant, 10−22, 10−3 (both red and blue scales); PU: 10−2, 10−12, 10−15 (blue scale) and 10−17 (red scale), 10−16 (red scale) and 10−34 (blue scale); TH: 10−18, 10−3 (blue scale), not significant, 10−30, 10−16. (C) Neuronal ensemble correlations for no-contact templates (taken from epochs within the novel stimulation period in which animals had no sensory contact with the novel objects) also show enhanced neuronal reverberation.
Figure 4
Figure 4. Neuronal Reverberation Depends on Behavioral State
(A) Histograms (mean ± SEM) of post- and prenovelty correlation ratios in the recording sites where significant state-related differences in neuronal ensemble correlations were detected. SW sleep post-/prenovelty correlation ratios were significantly higher than WK in all four cases (Bonferroni comparison p values as follows: rat 2, PU, SW>WK 0.013; rat 3, CX, SW>REM 0.017 and SW>WK 0.022; rat 4, HP, SW>REM 0.013 and SW>WK 0.039; rat 5, CX, SW>WK 0.0001 and REM>WK 0.0002). (B) Bonferroni comparison p values for post-/prenovelty comparisons in all animals according to behavioral state and brain area, calculated in intervals of 4 h. Animal order and time as in Figure 3B. Color bar in linear scale. (C) Neuronal ensemble correlations sorted by state for rat 5 CX. In comparison with WK, there is a clear increase in the contrast between pre- and postnovelty correlations during SW sleep. In this particular animal and brain area, increased correlations were also seen for REM sleep, but this was not the case in other animals (A). Furthermore, this REM effect was substantially weakened when expressed in p values (B), due to the very short duration of REM sleep episodes. In this respect, notice that REM sleep has much fewer datapoints, reflecting the short duration of this state relative to WK and SW sleep. Thus, even in a site where REM sleep showed results similar to SW sleep, the cumulative neuronal reverberation that takes place during REM is necessarily less than that of SW. (D) Statistical comparison of matches between templates of neuronal activity sampled at WK normal speed with a range of targets spanning different temporal scales. Plotted are Bonferroni comparison p values for post- and prenovelty comparisons in all animals according to behavioral state and brain area, calculated in intervals of 4 h for speed factors ranging from 20 times faster to two times slower than the WK normal rate. No evidence for optimization at speeds different from the WK physiological rate (1×) was found. Color scale as in (B).
Figure 5
Figure 5. Neuronal Reverberation Is Strongest during SW Sleep
(A) Rat 5 (CX) dramatically illustrates the state dependency of neuronal ensemble correlations, which are strongly increased by SW sleep but readily decreased by WK. The upper panel shows the firing rates of 38 cortical neurons for approximately 45 h after exposure to novel stimulation (indicated by an asterisk). The middle panel shows the superimposition of successive neuronal ensemble correlations and concurrent behavioral states. Nearly all correlation peaks correspond to SW episodes, while almost all troughs match WK epochs. The lower panel represents pooled LFP forebrain coherence (Amjad et al. 1997) over time, useful to discriminate between WK (strong coherence above 25 Hz and weak coherence under 5 Hz) and SW sleep (the opposite). Notice that in this particular example (rat 5, CX), REM episodes show correlations similar to those of SW sleep, but, as shown in Figure 4, this was the exception and not the rule across several animals. (B) State-dependent neuronal reverberation was sustained throughout the recording period, as shown by segments representing the beginning (3,200–3,300 min), middle (4,700–4,800 min), and end (5,200–5,250 min) of the experimental record. In the upper panel, notice the progressive increase of neuronal correlations across single SW sleep episodes. (C) Blow-up of two selected data segments indicated by asterisks in (A). Despite having being sampled from moments of high neuronal firing rates (asterisk), novel stimulation templates reverberate most strongly during SW sleep when firing rates are low (single asterisk and double asterisks). The high firing rates that characterize WK correspond to decreased neuronal reverberation, probably due to sensory interference.
Figure 6
Figure 6. Conceptual Model of the Role of Sleep for Memory Consolidation
Arrows indicate pathway activation by sensory inputs during WK, as well as intrinsic brain activity such as pontine waves during sleep (Datta 2000); different arrow sizes indicate different magnitudes of pathway activation. Red indicates calcium-dependent pretranscriptional processes, with different hue intensities representing the progressive amplification of recently acquired synaptic changes. Green indicates plasticity-related transcriptional regulation. The initial state of the model (data not shown) consists of environmental habituation, during which ongoing activity patterns only repeat themselves by chance. (First panel) A novel WK experience encodes a memory trace across multiple forebrain areas, selectively activating functionally related synapses. This triggers calcium-dependent pretranscriptional cascades (red) and plasticity-related gene expression (green) that lead to the common strengthening of the activated synapses. (Second panel) The continuation of WK involves a succession of unrelated sensory experiences capable of producing interference, i.e., a progressive weakening of recently encoded synaptic changes. (Third panel) Upon entering SW sleep, intrinsic brain activation is biased towards previously potentiated synapses, causing neuronal firing patterns originally produced during the novel WK experience to reverberate significantly above chance levels. (Fourth panel) The periodic activation of calcium-dependent second-messenger cascades by large-amplitude SW oscillations may result in the progressive amplification of the synaptic changes that encode the novel memory trace. (Fifth panel) SW-amplified synaptic changes are stored during REM sleep by way of plasticity-related transcriptional regulation.

References

    1. Amjad AM, Halliday DM, Rosenberg JR, Conway BA. An extended difference of coherence test for comparing and combining several independent coherence estimates: Theory and application to the study of motor units and physiological tremor. J Neurosci Methods. 1997;73:69–79. - PubMed
    1. Bontempi B, Laurent-Demir C, Destrade C, Jaffard R. Time-dependent reorganization of brain circuitry underlying long-term memory storage. Nature. 1999;400:671–675. - PubMed
    1. Bryson D, Schacher S. Behavioral analysis of mammalian sleep and learning. Perspect Biol Med. 1969;13:71–79. - PubMed
    1. Cermak L, Craik F. Levels of processing in human memory. Indianapolis: John Wiley and Sons. 1979:479.
    1. Craik F, Lockhart R. Levels of processing: A framework for memory research. J Verb Learn Verb Behav. 1972;11:671–684.

Publication types