Comparative Study
. 2004 Feb;2(2):E7.
doi: 10.1371/journal.pbio.0020007. Epub 2004 Jan 13.

Gene expression signature of fibroblast serum response predicts human cancer progression: similarities between tumors and wounds

Affiliations
Comparative Study

Gene expression signature of fibroblast serum response predicts human cancer progression: similarities between tumors and wounds

Howard Y Chang et al. PLoS Biol. 2004 Feb.

Abstract

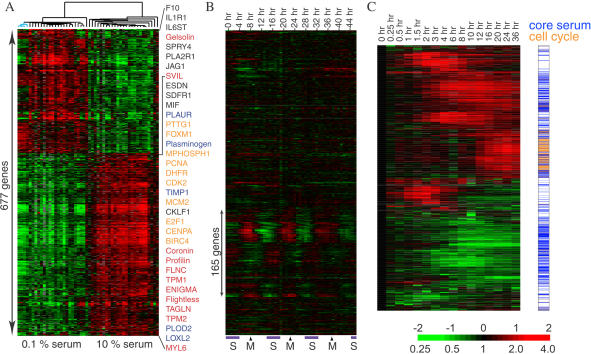
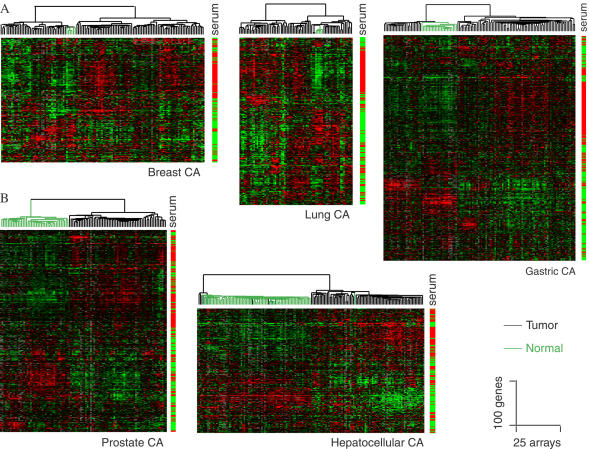
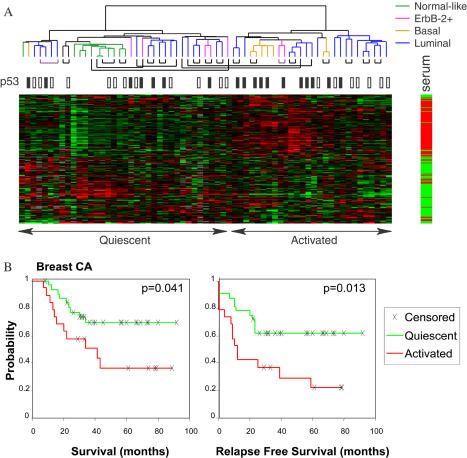
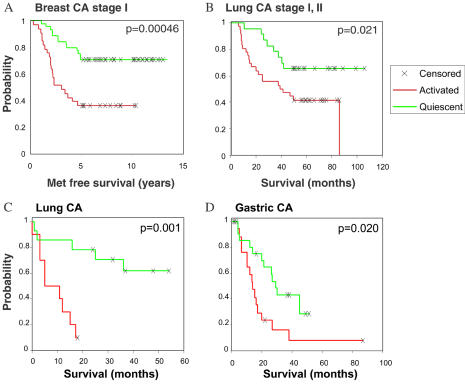
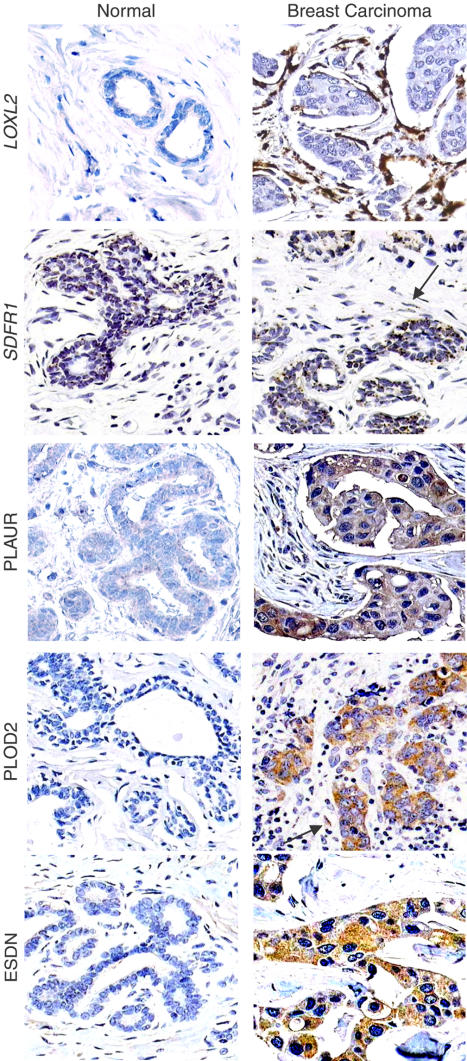
Cancer invasion and metastasis have been likened to wound healing gone awry. Despite parallels in cellular behavior between cancer progression and wound healing, the molecular relationships between these two processes and their prognostic implications are unclear. In this study, based on gene expression profiles of fibroblasts from ten anatomic sites, we identify a stereotyped gene expression program in response to serum exposure that appears to reflect the multifaceted role of fibroblasts in wound healing. The genes comprising this fibroblast common serum response are coordinately regulated in many human tumors, allowing us to identify tumors with gene expression signatures suggestive of active wounds. Genes induced in the fibroblast serum-response program are expressed in tumors by the tumor cells themselves, by tumor-associated fibroblasts, or both. The molecular features that define this wound-like phenotype are evident at an early clinical stage, persist during treatment, and predict increased risk of metastasis and death in breast, lung, and gastric carcinomas. Thus, the transcriptional signature of the response of fibroblasts to serum provides a possible link between cancer progression and wound healing, as well as a powerful predictor of the clinical course in several common carcinomas.


Conflict of interest statement

The authors have declared that no conflicts of interest exist.

Figures

Figure 1
Figure 1. Identification and Annotation of a Common Serum Response in Fibroblasts
(A) The fibroblast common serum response. Genes with expression changes that demonstrate coordinate induction or repression by serum in fibroblasts from ten anatomic sites are shown. Each row represents a gene; each column represents a sample. The level of expression of each gene in each sample, relative to the mean level of expression of that gene across all the samples, is represented using a red–green color scale as shown in the key; gray indicates missing data. Representative genes with probable function in cell cycle progression (orange), matrix remodeling (blue), cytoskeletal rearrangement (red), and cell–cell signaling (black) are highlighted by colored text on the right. Three fetal lung fibroblast samples, cultured in low serum, which showed the most divergent expression patterns among these samples (in part due to altered regulation of lipid biosynthetic genes [Chang et al. 2002]), are indicated by blue branches. (B) Identification of cell cycle-regulated genes in the common serum response signature. The expression pattern of each of the genes in (A) during HeLa cell cycle over 46 h after synchronization by double thymidine block is shown (Whitfield et al. 2002). Transit of cells through S and M phases during the timecourse, verified by flow cytometry, is indicated below. Approximately one-quarter of genes demonstrate a periodic expression patterns and are therefore operationally annotated as cell cycle genes; the remainder of the genes are used in further analyses to define the CSR. (C) Validation of annotation by temporal expression profiles. Timecourse of gene expression changes in a foreskin fibroblast culture after shifting from 0.1% to 10% FBS is shown. Global gene expression patterns were determined using cDNA microarrays containing 36,000 genes; genes whose transcript levels changed by at least 3-fold during the timecourse and those in (A) are displayed. The cell cycle genes identified in the analysis illustrated in (B) were found to have a distinct temporal expression pattern with coordinate upregulation at 12 h.
Figure 2
Figure 2. Survey of Fibroblast CSR Gene Expression in Human Cancers
Expression patterns of available CSR genes in over 500 tumors and corresponding normal tissues were extracted, filtered as described in Materials and Methods, and organized by hierarchical clustering. The response of each gene in the fibroblast serum response is shown on the right bar (red shows activated; green shows repressed by serum). The strong clustering of the genes induced or repressed, respectively, in fibroblasts in response to serum exposure, based solely on their expression patterns in the tumor samples, highlights their coordinate regulation in tumors. The dendrograms at the top of each data display represent the similarities among the samples in their expression of the fibroblast CSR genes; tumors are indicated by black branches, normal tissue by green branches.
Figure 3
Figure 3. Context, Stability, and Prognostic Value of Fibroblast CSR in Breast Cancer
(A) Expression patterns of CSR genes in a group of breast carcinomas and normal breast tissue previously described in Perou et al. (2000). Genes and samples were organized by hierarchical clustering. The serum response of each gene is indicated on the right bar (red shows induced; green shows repressed by serum). Note the biphasic pattern of expression that allows each tumor sample to be classified as “activated” or “quiescent” based on the expression of the CSR genes. The previously identified tumor phenotype (color code) and p53 status (solid black box shows mutated; white box shows wild-type) are shown. Pairs of tumor samples from the same patient, obtained before and after surgery and chemotherapy, are connected by black lines under the dendrogram. Two primary tumor–lymph node metastasis pairs from the same patient are connected by purple lines. (B) Kaplan–Meier survival curves for the two classes of tumors. Tumors with serum-activated CSR signature had worse disease-specific survival and relapse-free survival compared to tumors with quiescent CSR signature. Similar results were obtained whether performing classification using all breast tumors in this dataset or just the 58 tumors from the same clinical trial (Sorlie et al. 2001).
Figure 4
Figure 4. Prognostic Value of Fibroblast CSR in Epithelial Tumors
Kaplan–Meier survival curves of tumors stratified into two classes using the fibroblast CSR are shown for stage I and IIA breast cancer (van 't Veer et al. 2002) (A), stage I and II lung adenocarcinoma (Bhattacharjee et al. 2001) (B), lung adenocarcinoma of all stages (Garber et al. 2001) (C), and stage III gastric carcinoma (Leung et al. 2002) (D).
Figure 5
Figure 5. Histological Architecture of CSR Gene Expression in Breast Cancer
Representative ISH of LOXL2 and SDFR1 and IHC of PLOD2, PLAUR, and ESDN are shown (magnification, 200×). Panels for LOXL2, PLAUR, PLOD2, and ESDN represent cores of normal and invasive ductal breast carcinoma from different patients on the same tissue microarray. Panels for SDFR1 demonstrate staining in adjacent normal and carcinoma cells on the same tissue section. Arrows highlight spindle-shaped stromal cells that stain positive for SDFR1 and PLOD2. No signal was detected for the sense probe for ISH or for control IHC without the primary antibody.

References

    1. Akiri G, Sabo E, Dafni H, Vadasz Z, Kartvelishvily Y, et al. Lysyl oxidase-related protein-1 promotes tumor fibrosis and tumor progression in vivo . Cancer Res. 2003;63:1657–1666. - PubMed
    1. Alizadeh AA, Eisen MB, Davis RE, Ma C, Lossos IS, et al. Distinct types of diffuse large B-cell lymphoma identified by gene expression profiling. Nature. 2000;403:503–511. - PubMed
    1. Bergers G, Song S, Meyer-Morse N, Bergsland E, Hanahan D. Benefits of targeting both pericytes and endothelial cells in the tumor vasculature with kinase inhibitors. J Clin Invest. 2003;111:1287–1295. - PMC - PubMed
    1. Bhattacharjee A, Richards WG, Staunton J, Li C, Monti S, et al. Classification of human lung carcinomas by mRNA expression profiling reveals distinct adenocarcinoma subclasses. Proc Natl Acad Sci U S A. 2001;98:13790–13795. - PMC - PubMed
    1. Bissell MJ, Radisky D. Putting tumours in context. Nat Rev Cancer. 2001;1:46–54. - PMC - PubMed

Publication types