. 2004 Feb;135(2):209-18.
doi: 10.1111/j.1365-2249.2003.02359.x.

Qualitative and quantitative abnormalities in splenic dendritic cell populations in NOD mice

Affiliations

Qualitative and quantitative abnormalities in splenic dendritic cell populations in NOD mice

A C Vasquez et al. Clin Exp Immunol. 2004 Feb.

Abstract

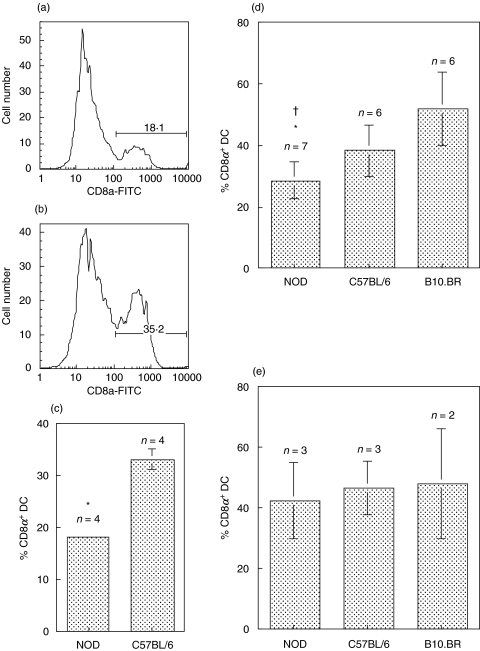
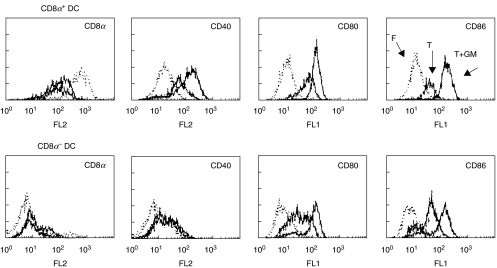
The phenotype and function of splenic DC populations from diabetes-prone NOD mice were characterized and compared to DC from diabetes-resistant strains in the presence or absence of Flt3 ligand (FL) treatment. NOD mice were found to have significantly fewer CD8alpha+ DC than both B10.BR and C57BL/6 mice, and this defect was reversed by FL treatment. Freshly isolated CD8alpha+ and CD8alpha- DC from all three strains were found to express similar levels of costimulatory molecules and this was similar in both FL-treated and untreated animals. IL-12 p40 production was significantly lower in purified CD11c+ DC from NOD mice compared to DC from C57BL/6 or B10.BR mice. CD8alpha+ DC isolated from NOD mice produced lower levels of IL-12p40 than CD8alpha+ DC from C57CBL/6 and this was dependent on the nature of the stimulus given. In contrast both CD8alpha+ and CD8alpha- DC from FL-treated mice produced high levels of IL-12p40 following activation, but only the CD8alpha- DC produced IL-12p70. Functionally, freshly isolated CD8alpha- DC were more stimulatory than CD8alpha+ DC in a primary allogeneic mixed lymphocyte reaction. However, DC maturation resulted in increased T cell stimulatory capacity for both DC subsets, and this pattern was seen in all strains. These results demonstrate significant differences in phenotype and function of splenic NOD CD8alpha+ DC, and further suggest that FL treatment may reverse some of these abnormalities.


Figures

Fig. 1
Fig. 1
NOD mice have fewer CD8α+ DC in the spleen than diabetes-resistant strains. Histograms of CD8α expression on gated CD11c+ cells from whole spleen are shown for (a) NOD and (b) C57BL/6. The numbers represent the percentages of CD11c+ DC that express CD8α. (c) The mean ± SD of the percentage CD11c+ CD8α+ DC from 4 individual NOD or C57BL/6 mice are presented in the bar graph. P = 0·0007 NOD compared to C57BL/6. (d) Similar results were obtained following purification of CD11c+ DC from untreated NOD, C57BL/6 and B10.BR mice. The means ± SD of the percentage CD11c+ CD8α+ DC from 6 to 7 experiments are shown. *P = 0·03 NOD compared to C57BL/6; †P = 0·001 NOD compared to B10.BR. (e) FL treatment reverses the defect in the proportion of CD8α+ DC in NOD mice. The proportions of CD8α+ DC were obtained from FACS analysis of whole spleen, gated on CD11c+ cells. The means ± SD of the percentage CD11c+ CD8α+ DC from 2 to 3 experiments are shown. In all cases side-by-side experiments of DC from NOD with one or both diabetes resistant strains were performed.
Fig. 2
Fig. 2
Overnight culture in cytokines induced DC maturation. Phenotype of splenic DC subsets from FL-treated mice after overnight culture in TNF-αalone (T, thick dark line) or in combination with GM-CSF (T+GM, thin solid line) as compared to freshly isolated (F, dotted line) DC. Results are representative of 3 experiments.
Fig. 3
Fig. 3
DC from NOD mice produced low levels of IL-12p40. (A) Purified splenic CD11c+DC from untreated mice were cultured for 24 h with SAC/IFN-γ/GM. IL-12 p40 production was significantly lower in NOD than C57BL/6 or B10.BR DC (*P = 0·03 and P = 0·009, respectively). (b) IL-12p40 production by DCs following 24 h incubation with TNF-α (▪) or LPS/IFN-γ (formula image
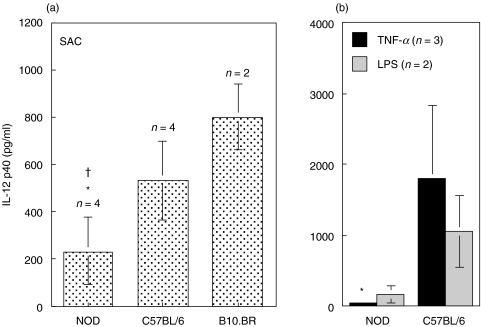
). IL-12p40 was lower in NOD compared to C57BL/6 DC (*P = 0·04) following stimulation with TNF-α. No IL-12 p70 was detected. Results are presented as the mean of cytokine production ± SD of the indicated number of side-by-side experiments.
Fig. 4
Fig. 4
CD8α+ DC from NOD produce low levels of Il-12p40 and this is reversed by FL treatment. (a, b) Purified CD8α+ and CD8α DC from untreated NOD and C57BL/6 were stimulated with the indicated stimuli. Supernatants were collected after 24 h and examined for the presence of (a) IL-12 p40 (b) IL-6 and IL-12p70 (not detected). The results shown are representative of 2–4 independent experiments. (c, d) Purified CD8α+ and CD8α DC from FL-treated mice were stimulated with SAC/IFN-γ/GM as described in the methods and examined for the production of (c) IL-12 p40 and (d) IL-12p70. The results shown are representative of 3 independent experiments.
Fig. 5
Fig. 5
Proliferation of allogeneic SWR T cells in response to fresh (a) or cultured (b) splenic CD8α+ and CD8α DC from FL-treated NOD mice. formula image 
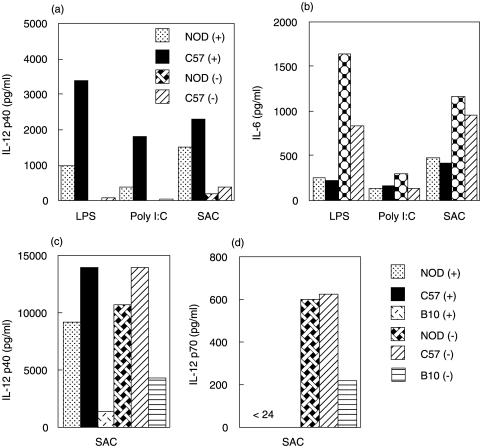
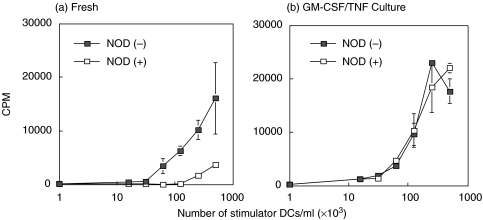
NOD(–); □ NOD(+) After overnight culture in TNF-α + GM-CSF, CD8α+and CD8α DC induce similar levels of proliferation in SWR T cells. Results represent the mean ± SD of triplicate cultures from a representative experiment of 3 MLR assays.
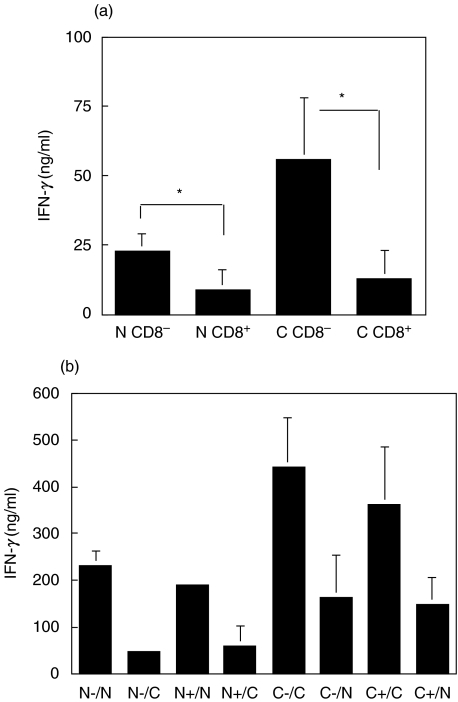
Fig. 6
Fig. 6
IFN-γ production by SWR T cells in a 7-day primary DC stimulation and upon restimulation with splenic APC. (a) IFN-γ production following 7 day primary stimulation of SWR T cells with CD8α+ and CD8α DC from FL-treated NOD or C57BL/6 mice (N = NOD; C = C57BL/6) (P-values: 0·033 *N CD8versus N CD8+ 0·035 *C CD8versus C CD8+). (b) IFN-γ production following a 2-day restimulation of SWR T cells with T-cell depleted NOD or C57BL/6 APCs. Following a primary stimulation for 7 days, T cells were collected and restimulated (0·5 × 106/ml) with splenic NOD or C57BL/6 APC (1 × 10⁶/ml) for 2 days. (N-/N = NOD CD8α DC as primary stimulator/NOD APC as secondary stimulator, etc.). Results presented in (a) and (b) are the means ± SD of 2–4 experiments.
Fig. 7
Fig. 7
Phenotype of SWR CD4+ T cells following 7-day culture with splenic DC from NOD and C57BL/6. Following incubation, the cells were collected, stained with anti-CD4, -CD62L and -CD25 mAbs and analysed using flow cytometry. (a) Phenotypical profile of SWR T cells prior to incubation with DC subsets. (b, c) Percentage of CD4hi T cells with the CD25+/CD62L+ (regulatory), CD25+/CD62L (activated), CD25/CD62L+ (naïve) and CD25/CD62L (resting) phenotype following stimulation by CD8α+ DC (b) or CD8α DC (c) from NOD (▪) or C57BL/6 (□) mice. *P = 0·048: CD25+/CD62L + T cells stimulated by NOD CD8α+ DC versus C57BL/6 CD8α+ DC; *P = 0·010: CD25+/CD62L- T cells stimulated by NOD CD8α+ DC versus C57BL/6 CD8α+ DC; *P = 0·0123: CD25-/CD62L- T cells stimulated by NOD CD8α+ DC versus C56BL/6 CD8α+ DC. Results represent the means ± SD of 2 experiments.
Fig. 8
Fig. 8
DC subsets can modulate the development of diabetes in NOD mice. Ability of CD8+ (♦) and CD8 (○) splenic DC to modulate diabetes development in NOD mice. NOD mice (5 weeks of age; 10 mice/group) were given peptide-pulsed DC (4 × 10⁵ DC/mouse iv) as described in the methods and were monitored for the development of diabetes. Control mice received an iv injection of PBS (▪). Results shown are from two independent experiments.

References

    1. Kronin V, Winkel K, Suss G, Kelso A, Heath W, Kirberg J, von Boehmer H, Shortman K. A subclass of dendritic cells regulates the response of naive CD8 T cells by limiting their IL-2 production. J Immunol. 1996;157:3819–27. - PubMed
    1. Suss G, Shortman K. A subclass of dendritic cells kills CD4 T cells via Fas/Fas-ligand-induced apoptosis. J Exp Med. 1996;183:1789–96. - PMC - PubMed
    1. Nakano H, Yanagita M, Gunn MD. CD11c(+)B220(+)Gr-1(+) cells in mouse lymph nodes and spleen display characteristics of plasmacytoid dendritic cells. J Exp Med. 2001;194:1171–8. - PMC - PubMed
    1. Vremec D, Zorbas M, Scollay R, Saunders DJ, Ardavin CF, Wu L, Shortman K. The surface phenotype of dendritic cells purified from mouse thymus and spleen: investigation of the CD8 expression by a subpopulation of dendritic cells. J Exp Med. 1992;176:47–58. - PMC - PubMed
    1. Vremec D, Pooley J, Hochrein H, Wu L, Shortman K. CD4 and CD8 expression by dendritic cell subtypes in mouse thymus and spleen. J Immunol. 2000;164:2978–86. - PubMed

Publication types

MeSH terms