. 2004 Feb;74(2):317-25.
doi: 10.1086/381716. Epub 2004 Jan 21.

Matching strategies for genetic association studies in structured populations

Affiliations

Matching strategies for genetic association studies in structured populations

David A Hinds et al. Am J Hum Genet. 2004 Feb.

Abstract

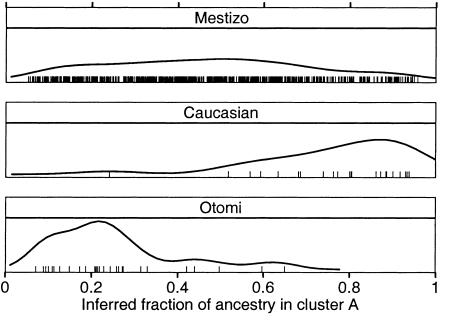
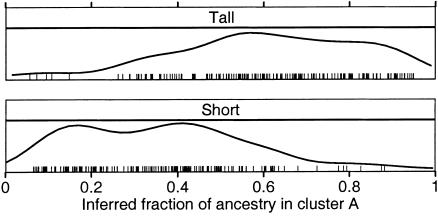
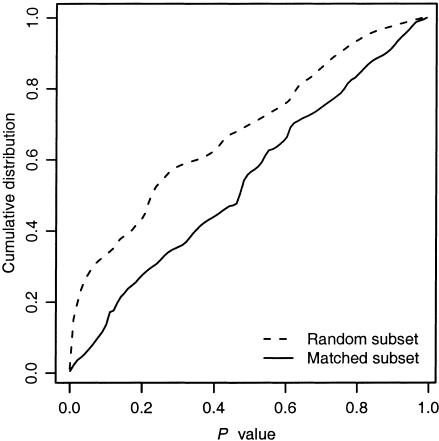
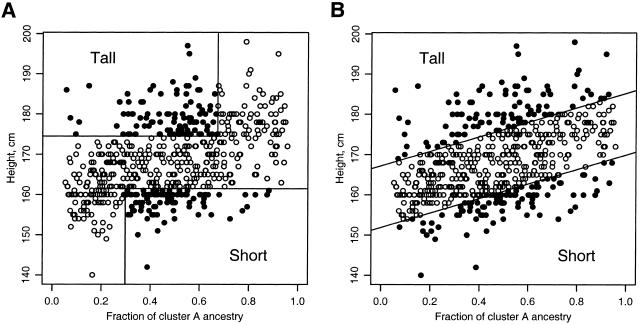
Association studies in populations that are genetically heterogeneous can yield large numbers of spurious associations if population subgroups are unequally represented among cases and controls. This problem is particularly acute for studies involving pooled genotyping of very large numbers of single-nucleotide-polymorphism (SNP) markers, because most methods for analysis of association in structured populations require individual genotyping data. In this study, we present several strategies for matching case and control pools to have similar genetic compositions, based on ancestry information inferred from genotype data for approximately 300 SNPs tiled on an oligonucleotide-based genotyping array. We also discuss methods for measuring the impact of population stratification on an association study. Results for an admixed population and a phenotype strongly confounded with ancestry show that these simple matching strategies can effectively mitigate the impact of population stratification.


Figures

Figure  1
Figure 1
Distribution of ancestry for self-reported population subgroups. Density distributions for the inferred fraction of subjects with cluster A ancestry are shown for 655 Mestizo, 23 Caucasian, and 29 Otomi Indian subjects. Each tick mark represents the fractional ancestry of an individual subject.
Figure  2
Figure 2
Distribution of ancestry versus height categories. Density distributions for the inferred fraction of subjects with cluster A ancestry are shown for 164 short and 166 tall subjects. Each tick mark represents the fractional ancestry of an individual subject.
Figure  3
Figure 3
Cumulative distribution of P values for 275 SNPs, for the random and ancestry-matched subsets of tall and short subjects. In the absence of population structure, the P values should be uniformly distributed, and their cumulative distribution should be a straight line from (0,0) to (1,1). The random subset shows an excess of small P values, whereas the matched subset has a nearly uniform distribution.
Figure  4
Figure 4
Comparison of a matching strategy with independently determined cutoffs for height and ancestry (A) and a strategy based on a linear regression of height against ancestry (B). The samples retained from tall and short subjects by use of each method are shown as blackened circles, and excluded samples are shown as unblackened circles. The regression method results in inclusion of the tallest and shortest individuals within any narrow window of ancestry values.
Figure  5
Figure 5
Effect of simulated experimental error on an overall population-structure test statistic. We simulated the effect of experimental error by adding normally distributed noise to allele-frequency estimates in permuted copies of the genotype data for the matched tall and short groups. The overall test statistic is the sum of resulting χ2 statistics for the 275 individual SNPs; this is expected to follow a χ2 distribution, with 275 df. We show results for 20 separate permutations for each value of the noise parameter.

Similar articles

Cited by

References

Electronic-Database Information

    1. dbSNP Home Page, http://www.ncbi.nlm.nih.gov/SNP/ (for ss12673803–ss12674077)
    1. Genetic Epidemiology Group Web Site, http://www.lshtm.ac.uk/eu/genetics/ (for ADMIXMAP software)
    1. NCBI BLAST, http://www.ncbi.nlm.nih.gov/BLAST/ (for BLAST search engine)
    1. NCBI Home Page, http://www.ncbi.nlm.nih.gov/
    1. Pritchard Lab, http://pritch.bsd.uchicago.edu/ (for the structure program)

References

    1. Ardlie KG, Lunetta KL, Seielstad M (2002) Testing for population subdivision and association in four case-control studies. Am J Hum Genet 71:304–311 - PMC - PubMed
    1. Altschul SF, Gish W, Miller W, Myers EW, Lipman DJ (1990) Basic local alignment search tool. J Mol Biol 215:403–41010.1006/jmbi.1990.9999 - DOI - PubMed
    1. Barratt BJ, Payne F, Rance HE, Nutland S, Todd JA, Clayton DG (2002) Identification of the sources of error in allele frequency estimations from pooled DNA indicates an optimal experimental design. Ann Hum Genet 66:393–40510.1046/j.1469-1809.2002.00125.x - DOI - PubMed
    1. Cardon LR, Palmer LJ (2003) Population stratification and spurious allelic association. Lancet 361:598–60410.1016/S0140-6736(03)12520-2 - DOI - PubMed
    1. Chakraborty R, Weiss KM (1988) Admixture as a tool for finding linked genes and detecting that difference from allelic association between loci. Proc Natl Acad Sci USA 85:9119–9123 - PMC - PubMed