. 2004 Feb;72(2):937-48.
doi: 10.1128/IAI.72.2.937-948.2004.

Mycobacterium bovis BCG cell wall-specific differentially expressed genes identified by differential display and cDNA subtraction in human macrophages

Affiliations

Mycobacterium bovis BCG cell wall-specific differentially expressed genes identified by differential display and cDNA subtraction in human macrophages

Nasim A Begum et al. Infect Immun. 2004 Feb.

Abstract

We have analyzed the gene expression profile of monocytes in response to a highly purified cell wall fraction of Mycobacterium bovis BCG, a clinically approved adjuvant known as BCG cell wall skeleton (BCG-CWS). It is composed of mycolic acid, arabinogalactan, and peptidoglycan and confers Toll-like receptor 2 (TLR2)- and TLR4-dependent signaling that induces monocytes to differentiate into antigen-presenting cells (APCs). Here we report differential gene expression analysis with BCG-CWS-stimulated versus nonstimulated monocytes. BCG-CWS exerted massive induction of genes regulated by TLR signaling. Marked gene regulatory characteristics in BCG-CWS-stimulated cells compared to lipopolysaccharide (LPS)-stimulated cells follow. (i) Spliced mRNAs encoding soluble forms of TREM-1 and TREM-2 (recently discovered inflammatory-signal-amplifying receptors) were regulated by BCG-CWS, resulting in their differential expression. (ii) The genes for zinc-iron transporter protein (ZIP)-like family proteins HKE-1 and LIV-1 were induced exclusively by BCG-CWS. (iii) Interleukin-23 (IL-23), rather than IL-12p70, was induced by BCG-CWS, while interferon-inducible genes were induced only by LPS. By Northern and reverse transcription-PCR analyses, we confirmed the differential expression of more than 30 BCG-CWS regulatory genes, and their expression was compared with that of LPS and other known TLR ligands. A battery of genes responded rapidly and for a short time to LPS but for a long time to BCG-CWS. Structural analysis of the identified novel or hypothetical proteins revealed that some are potential candidates as signaling mediators or transcriptional regulators. Hence, BCG-CWS may profoundly modulate APC responses in a way distinct from that of LPS, leading to possible advantages for its adjuvant-active therapeutic potential.


Figures

FIG. 1.
FIG. 1.
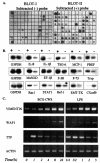
Identification of BCG-CWS-regulated genes in monocytes with Atlas cDNA arrays. (A) Hybridization of two identical gene array membranes with radiolabeled BCG-CWS(−) and BCG-CWS(+) cDNA probes. The probes were the BCG-CWS-induced and -suppressed cDNA fractions, respectively, and were obtained by SSH. The autoradiographic image of each membrane is presented as six blocks (numbered 1 to 6), and the type of probe used for each is shown on the left. Numbers below the blot indicate the genes whose signals are pointed out by arrows or arrowheads. These numbers correspond to the gene numbers in the bar graph. PLA2, phospholipase A2; MHC, major histocompatibility complex; Ribo.prot., ribosomal protein. (B) Quantitative representation of the gene array analysis. The genes that were exclusively detected with the plus (+) or minus (−) probe are shown first (numbered 1 to 49), and the genes that were detected with both probes are shown next (numbered 50 to 65). The intensities of the signals determined with the plus and minus probes were plotted and are indicated by filled and open bars, respectively. The genes for vimentin (no. 52) and IFN-γ receptor accessory factor (no. 65) are marked by arrowheads in blocks 1 and 6, respectively, and the two highly intense signals in block 2 are for the caspase 10 gene. Four exclusively inducible genes, those for CDK inhibitor Waf/p21 (no. 2), STAT1 (no. 10), TMP21 (no. 17), and EB1 (no. 30), are indicated by diagonal arrows on the plus probe blot (lower part of panel A, blocks 1, 2, 3, and 5, respectively), and the corresponding regions with no signals are also indicated in the minus probe blot (upper part of panel A). Expression of signaling intermediates EPS8 (no. 19) and zyxin (no. 26) was detected only with the BCG-CWS(−) probe and is shown by upward-pointing arrows in blocks 3 and 4, respectively.
FIG. 2.
FIG. 2.
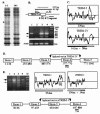
Differential screening and confirmation of differential expression. (A) A forward-subtracted library with putative BCG-CWS-inducible clones was initially constructed. Clones were selected randomly from the library, and the inserts were amplified by PCR; 90 PCR fragments were spotted per membrane in duplicate (blots I and II) and further hybridized with the subtracted cDNA probes. A typical result of this differential screening is shown in which most of the candidate inducible clones were positive with the plus probe. (B) Northern blot analysis to confirm the differential expression of 15 genes in response to BCG-CWS treatment. Total RNA was isolated from freshly prepared monocytes stimulated with BCG-CWS for 8 h. Lanes containing induced and noninduced RNAs are indicated by plus and minus signs, respectively, above the blots. Gene names are shown below the blot; F-38 and F-73 are as-yet-unidentified genes. EF-1β, elongation factor 1β; Trxp, thioredoxin peroxidase; Ref-1, redox factor 1. (C) RT-PCR analysis of vimentin, WAF1, and tristetraprolin mRNAs in monocytes induced by BCG-CWS or LPS. Total RNA was isolated at the indicated times and subjected to RT-PCR along with appropriate controls. Amplification of the actin housekeeping gene from the same samples confirms the equivalence of the amounts of cDNA.
FIG. 3.
FIG. 3.
Differential regulation of Ig superfamily genes and lectin receptors by bacterial cell wall. RT-PCR analysis was performed with mRNA isolated from monocytes stimulated with BCG-CWS or LPS for the indicated times. TREM-1, together with a related variant form (shown by an arrow) was up-regulated gradually, while TREM-2 was down-regulated. Induction of the type C lectin MDL by BCG-CWS was prominent during the late period, and moderate induction was detected in the case of LPS by 2 h. DAP12 with no induction can be considered an internal control. CRACC gene expression was time dependent in response to the PAMP. The experiments were performed four times with different time frames. Representative results obtained with two individual samples (panels A and B) are shown.
FIG. 4.
FIG. 4.
Identification of non-TM isoforms of TREM. (A) Portion of a differential display showing a weak band (*) present only in the BCG-CWS-untreated monocyte RNA lane minus. (B) Schematic representation showing the approximate position of the identified DDRT-PCR fragment (*) compared to that of the reported TREM-2 transcript (GenBank accession no. NM_018965). The positions of the two primers used for the RT-PCR, P1 and P2, are also indicated above the map. The black bar shows the 411-bp product derived from TREM-2, and the gray bar indicates the 217-bp product (identical in sequence to the DDRT-PCR [DD-RT] fragment). orf, open reading frame. In lanes 1, 2, 3, and 4, RNAs from monocytes, BCG-CWS-treated monocytes, iDCs, and DCs, respectively, were used for RT-PCR. Lane M, molecular size markers. (C) Hydrophobicity plots of TREM-2 and TRM-2V proteins showing the absence of the TM region in TREM-2V. The bars below the plot indicate their identical and unique regions. aa, amino acids. (D) Comparison of the exon-intron organization of TREM-2 and that of TREM-2V. The spliced-out region in TREM-2V is indicated on the genomic structure of TREM-2. (E) Identification of sTREM-1, a non-TM variant of TREM-1. The RT-PCR results, hydrophobicity plots, and difference in exon-intron organization between TREM-1 and sTREM-1 are presented. Black and gray arrows denote the TREM-1 and sTREM-1 PCR products, respectively.
FIG.5.
FIG.5.
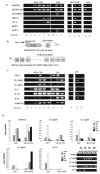
Novel membrane proteins and classic inflammatory mediators are both equally targeted by PAMP induction. (A) Expression analysis of five novel membrane proteins (SIMPLE, BIGM103, KIA0062, HKE4, and LIV-1) together with two zinc transporters, hZIP1 and hZIP2. RT-PCR was performed with total RNAs prepared at different times after BCG-CWS and LPS treatment of monocytes as described in Materials and Methods. Results from two different individual samples are shown (right and left sides). (B) Schematic representation showing the structural features of the two BCG-CWS-inducible novel membrane proteins, SIMPLE and BIGM103 (BIGMo-103). SIMPLE consists of an N-terminal proline-rich (Prol. rich) region with a Nedd4-interacting motif and a C terminus with a TM and a unique region (37). The region homologous with the ZIP transporter family protein is indicated above. Lyso, lysosome; endo. and Endo., endosome. (C) Expression profiles of a set of known and commonly induced monocyte activation-related genes. RT-PCR was done with the same reverse-transcribed cDNA samples that were used for the membrane protein analysis mentioned above (panel A). LPS-stimulated monocytes were separately examined with a different sample (left side), and similar results were obtained. Only the results for the indicated time points are shown. (D) Quantitative PCR analysis of BCG-CWS regulatory genes. Total RNA was isolated and converted to cDNA for quantitative real-time PCR analysis with primers specific for SIMPLE, IL-12p40, IL-12p35, IL-23p19, and IP-10. Experiments were repeated with three samples, and a representative one is presented in copy numbers with reference to the threshold analyses (see Fig. 6). cont, control.
FIG. 6.
FIG. 6.
Determination of cytokine levels by real-time PCR. Dose-dependent increases in the copy numbers of mRNAs in macrophages in response to LPS or BCG-CWS were measured. (Top) PCR samples were extracted from agarose gels and used as a template to evaluate the threshold cycles in each sample. mRNA copy numbers were estimated from the graphs. (Bottom) Cells were stimulated with the indicated doses of LPS or BCG-CWS for 8 h (IL-23p19) or 4 h (IP-10), and RNA samples were analyzed as described in the legend to Fig. 5D. Data are representative of three independent experiments.
FIG. 7.
FIG. 7.
Comparison of differential gene expression in response to TLR-specific PAMPs. (A) RT-PCR analysis of 10 genes, including that for actin, performed with nonstimulated (NS) and PAMP-stimulated monocyte RNAs (stimulated for 2, 6, or 8 h). For TREM-1 and DAP12, only the expression pattern at 6 h of stimulation is shown. CCR7, IP-10, IL-23p19, and MxA expression was analyzed in a different preparation of monocytes following 8 h of stimulation. The concentrations of ligands for TLR4 (LPS), TLR2 (PGN, MALP-2 [MALP], lipoteichoic acid [LTA], zymosan [ZYM]), TLR3 [poly(I-C) (PIC)], TLR2, TLR4, PGN derived from BCG (BPGN) (52), and TLR9 (GpC and CpG ODN) are described in Materials and Methods. (B) Summary of the genes for which we detected differential expression in response to at least one of the PAMPs [BCG-CWS, LPS, and poly(I-C)] tested. The plus and minus signs indicate whether a particular gene responded to the respective TLR ligand or not. Transcriptional up- or down-regulation is shown by up or dn next to a plus sign, and nd indicates that the status was not determined. MCP1, macrophage chemotactic protein 1.

References

    1. Akazawa, T., H. Masuda, Y. Saeki, M. Matsumoto, K. Takeda, S. Akira, I. Azuma, K. Toyoshima, and T. Seya. Adjuvant-mediated tumor regression and tumor-specific CTL induction are impaired in MyD88-deficient mice. Cancer Res., in press. - PubMed
    1. Akira, S., K. Takeda, and T. Kaisho. 2001. Toll-like receptors: critical proteins linking innate and acquired immunity. Nat. Immunol. 2:675-680. - PubMed
    1. Angell, J. E., D. J. Lindner, P. S. Shapiro, E. R. Hofmann, and D. V. Kalvakolanu. 2000. Identification of GRIM-19, a novel cell death-regulatory gene induced by the interferon-beta and retinoic acid combination, using a genetic approach. J. Biol. Chem. 275:33416-33426. - PubMed
    1. Azuma, I., and T. Seya. 2001. Development of immunoadjuvants for immunotherapy of cancer. Int. Immunopharmacol. 1:1249-1259. - PubMed
    1. Bakker, A. B., E. Baker, G. R. Sutherland, J. H. Phillips, and L. L. Lanier. 1999. Myeloid DAP12-associating lectin (MDL)-1 is a cell surface receptor involved in the activation of myeloid cells. Proc. Natl. Acad. Sci. USA 96:9792-9796. - PMC - PubMed

Publication types

MeSH terms

LinkOut - more resources