. 2004 Apr;15(4):1969-80.
doi: 10.1091/mbc.e03-09-0675. Epub 2004 Jan 23.

Calcium signaling is involved in dynein-dependent microtubule organization

Affiliations

Calcium signaling is involved in dynein-dependent microtubule organization

L'ubica Adamíková et al. Mol Biol Cell. 2004 Apr.

Abstract

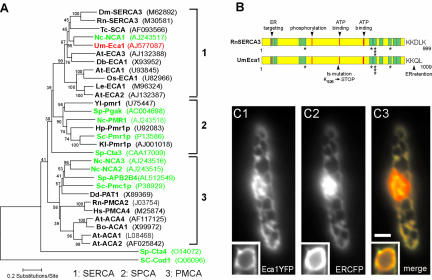
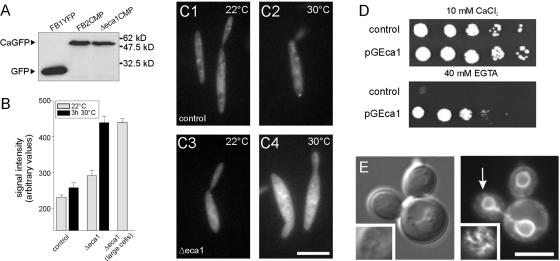
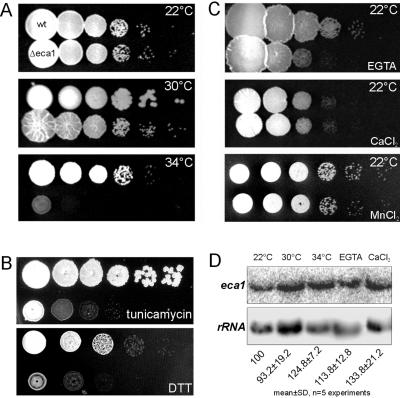
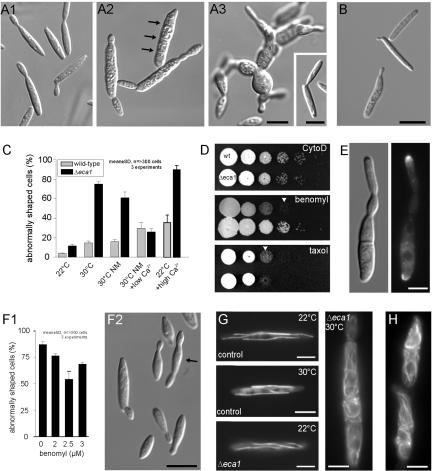
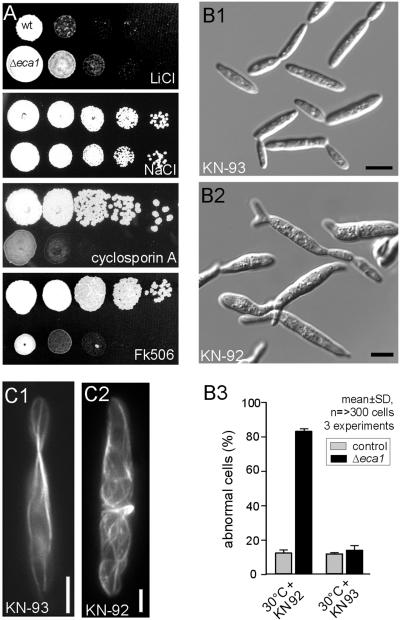
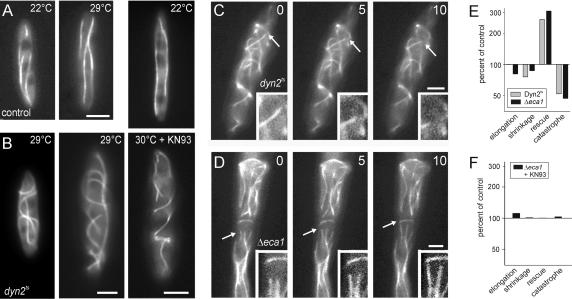
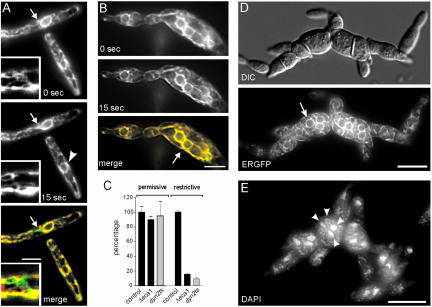
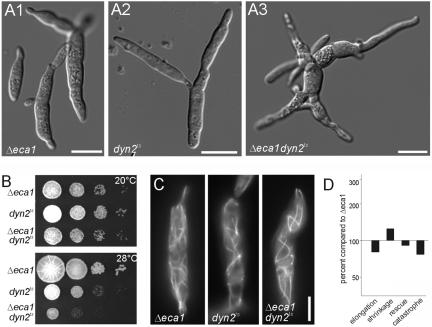
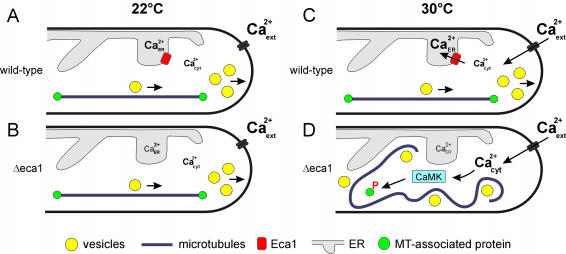
The microtubule cytoskeleton supports cellular morphogenesis and polar growth, but the underlying mechanisms are not understood. In a screen for morphology mutants defective in microtubule organization in the fungus Ustilago maydis, we identified eca1 that encodes a sarcoplasmic/endoplasmic calcium ATPase. Eca1 resides in the endoplasmic reticulum and restores growth of a yeast mutant defective in calcium homeostasis. Deletion of eca1 resulted in elevated cytosolic calcium levels and a severe growth and morphology defect. While F-actin and myosin V distribution is unaffected, Deltaeca1 mutants contain longer and disorganized microtubules that show increased rescue and reduced catastrophe frequencies. Morphology can be restored by inhibition of Ca(2+)/calmodulin-dependent kinases or destabilizing microtubules, indicating that calcium-dependent alterations in dynamic instability are a major cause of the growth defect. Interestingly, dynein mutants show virtually identical changes in microtubule dynamics and dynein-dependent ER motility was drastically decreased in Deltaeca1. This indicates a connection between calcium signaling, dynein, and microtubule organization in morphogenesis of U. maydis.


Figures

Figure 1.
Figure 1.
Eca1 belongs to type 3 SERCAs and localizes to the ER. (A) Eca1 groups with other sacroplasmic/ER Ca2+ ATPases (SERCA) in a dendrogram. Fungal Ca2+ ATPases are highlighted in green. SPCA, secretory pathway Ca2+-ATPase; PMCA, plasma membrane Ca2+-ATPase. Bootstrap values are at each node and accession numbers are in parentheses. (B) Domain organization of Eca1 and SERCA3 from rat. Predicted transmembrane domains are indicated in green, and residues involved in Ca2+ binding are marked with an asterisk. Note that the temperature-sensitive mutation in Eca1ts results in a STOP codon. (C) An Eca1YFP fusion protein and an ER-targeted ER-CFP fusion protein (C2) colocalize within the peripheral ER network and the nuclear envelope (insets) of haploid U. maydis cells. Bar, 2 μm.
Figure 3.
Figure 3.
Eca1 functions in Ca2+ homeostasis. (A) Western blots of cell extracts of strains that express a cytoplasmic GFP-based Ca2+ probe (Nakai et al., 2001). An anti-GFP antibody detects the M13-cpEGFP-CaM fusion protein in reference strain FB2CMP and mutant strain FB2ΔEca1CMP. Detection of YFP in extracts of FB1YFP is given as control. (B) Quantitative analysis of Ca2+ sensitive M13-cpEGFP-CaM signals at 22 and 30°C. At 22°C, cells of reference strain FB2CMP show faint cytoplasmic staining that slightly increases after shift to 30°C. In contrast, in normal shaped Δeca1 mutants the M13-cpEGFP-CaM-based fluorescence is already slightly evaluated, and growth at 30°C significantly increased the signal. A small portion of Δeca1 mutant cells show impaired morphology at 22°C that coincides with increased M13-cpEGFP-CaM fluorescence. Note that the graph was corrected for the background signal of U. maydis cells without GFP. Sample size is 18-34 cells and 4 for “Δeca1 large cells” at 22°C. (C) Examples of M13-cpEGFP-CaM signals in cells of reference strain FB2CMP and mutant strain FB2ΔEca1CMP. Bar, 10 μM. (D) Yeast strain K616 expressing a control plasmid (control) is unable to grow in the absence of Ca2+. Expression of eca1 (pGEca1) complements this defect, demonstrating that EcaI is involved in Ca2+ homeostasis. (E) Differential interference contrast image and corresponding fluorescence image of yeast strain K616Eca1YFP that expresses a functional Eca1-YFP fusion protein. Note that Eca1 localizes to the ER and the nuclear envelope (white arrow, insets show peripheral focal plane). Bar, 2 μm.
Figure 2.
Figure 2.
Δeca1 mutants are sensitive to temperature, EGTA, and ER stress. (A) Growth of wild-type control (wt) and Δeca1 mutants (Δeca1) at 22, 30, and 34°C. Note that regular growth temperature for U. maydis is 28-30°C. (B) Growth of wild-type and Δeca1 mutants at 22°C on plates containing tunicamycin (2.5 μg/ml) and DTT (2 mM). Both inhibitors affect protein processing within the ER, suggesting that Ca2+-dependent protein folding in the ER is impaired in Δeca1 mutants. (C) Growth at 22°C on agar supplemented with EGTA (5 mM), Ca2+ (250 mM), or Mn2+ (10 mM). Note that treatment with CaCl2 did not affect colony formation, but had a negative effect on cell morphology and MT organization (Figure 4, C and H). (D) Northern analysis of eca1 expression in FB2 under temperature and Ca2+ stress conditions. The experiment was repeated five times and eca1 signals at 22°C, corrected by loading controls, were normalized to 100%. Note a significant increase under 50 mM Ca2+ and 34°C.
Figure 4.
Figure 4.
Temperature-dependent morphology defect of Δeca1 mutants is associated with defects in microtubule organization. (A) Morphology of Δeca1 mutant cells. At 22°C, Δeca1 mutant cells are similar to control cells (A1; for control, see inset in A3). At 30°C, cells enlarge, start to grow at both cell poles, and fail to separate (A2, septa indicated by arrows; 4 h at 30°C). With extended time at 30°C, Δeca1 mutant cells form large structures of unseparated and often rounded cells (A3, 12 h). Under the same conditions, the control strain FB2 is unaffected (A3, inset). Bars, 5 μm. (B) Morphology of Δeca1 mutant cells shifted in low Ca2+ medium. Reduction of external Ca2+ suppressed the morphology phenotype of Δeca1 cells after 4 h at 30°C. Bar, 5 μm. (C) Quantitative analysis of morphology defects of Δeca1 mutants compared with wild-type control. Morphology of strain FB2 was virtually unaffected by temperature, whereas 75-80% aberrant mutant cells were observed after 4-5 h at 30°C. Similar results were obtained in minimal medium supplemented with Ca2+ (NM). However, no difference between control and mutant cells was found in minimal medium with reduced Ca2+ (NM, low Ca2+). eca1 mutants are much more sensitive to treatment with 250 mM Ca2+. All data points are based on three experiments with >100 cells each. For criteria of abnormal morphology, see MATERIALS AND METHODS. (D) Effect of cytoskeletal inhibitors on plate growth of wild-type and Δeca1 mutants strains. No difference between Δeca1 mutants and wild-type cells was found in the presence of the actin inhibitor cytochalasin D (10 μM). In contrast, Δeca1 cells are less sensitive to the MT destabilizing drug benomyl (1 μM, arrowhead) and slightly more sensitive to taxol (3 μM, arrowhead), indicating a link between MT stability and the growth phenotype of Δeca1 mutants. (E) Polar localization of a fusion of GFP and a class V myosin from U. maydis in Δeca1 mutants after 3h at 30°C. F-actin-dependent localization of GFP-Myo5 is not impaired in Δeca1, suggesting that Myo5 transport activity is not impaired. Bar, 5 μm. (F) Effect of low concentrations of the microtubule inhibitor benomyl on morphology of Δeca1. In liquid culture, 2.5 μM benomyl significantly restored morphology of Δeca1 (F1; 4-5 h at 30°C), with less cells showing separation defects or multiple budding. Note that even cells that were considered abnormal showed improved morphology (arrow in F2; for comparison, see 4A2 and 4E). Bar, 10 μm. (G) Organization of MTs in FB2GT and FB2 ΔEca1GT. At 22 and 30°C (4 h), control cells contained straight MTs, labeled with GFP-αtubulin. At 22°C, Δeca1 mutants contain normal MTs, but at 30°C MTs became longer and heavily disordered (4 h at 30°C). Note that MTs leave the focal plane, thereby looking shorter. Bar, 5 μm. (H) Reference strain FB2GT treated with high levels of Ca2+ (250 mM, 4 h). High external Ca2+ strongly affected MT organization in many cells, which is reminiscent of MT defects in Δeca1 mutants at 30°C and normal Ca2+ levels. Bar, 5 μm.
Figure 5.
Figure 5.
Δeca1 mutants require the Ca2+-dependent phosphatase calcineurin for stress tolerance, and show increased CaMK activity. (A) Δeca1 mutants show normal growth at high levels of Li2+ (7.5 mM) and Na2+ (0.5M). Calcineurin inhibition with cyclosporin A (15 μg/ml) or FK506 (4 μg/ml), result in reduced viability of Δeca1 mutants at high temperature (30°C). This aggravation of the phenotype by inhibition of Ca2+-dependent protein dephosphorylation suggests that protein phosphorylation is involved in the observed defects of Δeca1 cells. (B) Inhibition of CaMKs restored the morphology phenotype of Δeca1 mutants at 30°C. Δeca1 mutants showed normal morphology at 30°C when grown in the presence of the specific CaMK inhibitor KN-93 (60 μM; B1). In contrast, the inactive analogue KN-92 has no restorative effect (B2 and B3). This observation argues for an involvement of Ca2+-dependent protein phosphorylation in the Δeca1 phenotype. Bars, 5 μm. (C) Inhibition of CaMKs rescues the MT defect of Δeca1 mutants at 30°C. In FB2ΔEca1GT, KN-93 (C1) restores organization of MTs, but the inactive analogue KN-92 was without effect (C2). Bars, 2 μm.
Figure 6.
Figure 6.
Conditional dynein mutants and Δeca1 mutants share defects in MT dynamics and organization. (A) Reference strain FB1GT contained straight GFP-labeled MTs at 22 and 29°C. Bar, 3 μm. (B) MTs were normal in dynein mutants that contain a temperature-sensitive dynein allele (Wedlich-Söldner et al. 2002a), but severely altered at restrictive conditions (4-6 h at 29°C). Treatment with the CaMK inhibitor KN-93 was without effect on the dynein phenotype at restrictive conditions (3.5 h at 30°C). Note that this phenotype resembles that of Δeca1 mutants. Bars, 3 μm. (C and D) Dynamic behavior of MTs in dyn2ts (C) and Δeca1 (D) mutants. At restrictive temperature, both strains contain numerous curved MTs that show dynamic instability, including shrinkage due to depolymerization (arrow and inset in C) and polymerization-based elongation. Time in seconds is given in the upper right corner. Bar, 3 μm. (E) Parameters of MT dynamic instability in FB1Dyn2tsGT and FB2ΔEca1GT at restrictive conditions compared with reference strains FB1GT and FB2GT, respectively. Note the striking similarity between Δeca1 and dyn2ts mutants. For actual numbers, see Table 2. (F) CaMK inhibition by KN-93 restores most parameters of dynamic instability but did not affect the catastrophe value. Nevertheless, most mutant cells contained well-organized and shorter MTs.
Figure 7.
Figure 7.
ER organization, ER motility, and nuclear migration in Δeca1 and dynein mutants. (A) ER motility in control cells. The network undergoes prominent motility (arrows; see inset for example at higher magnification) that is based on dynein activity (Wedlich-Söldner et al., 2002a). In pseudocolored overlay displacements reduce the regions of colocalization that are indicated in yellow. Arrowhead indicates the nuclear envelope. Time interval is given at the bottom. Bar, 5 μm. (B) ER motility in Δeca1. There is significantly reduced ER tubule motility over the 15-s observation period, as can be seen from the pseudocolor merge image. Note that Δeca1 mutants contain an irregular network of ER tubules. This organization is in contrast to reference strain FB2EG, in which the ER network is localized to the cell periphery. Arrow indicates a nuclear envelope. Time interval is given at the bottom. Bar, 5 μm. (C) Quantitative analysis of ER motility in control, Δeca1 and dynts cells. ER motility in Δeca1 mutants was measured as displacements per square micrometer and second according to Wedlich-Söldner et al. (2002a). Values for dyn2ts mutants are taken from the same reference. In both mutants ER motility is abolished at restrictive conditions. (D) Nuclear distribution defect in Δeca1 after overnight incubation at 30°C. Mutant cell form swollen cell chains that contained numerous nuclei, as indicated in corresponding fluorescent image of ER-GFP labeled nuclear envelopes (arrow). Bar, 10 μm. (E) DAPI staining of nuclei and fragmented mitochondria in Δeca1 at 30°C. Staining the nuclear DNA by DAPI (in one cell indicated by arrowheads) confirms the nuclear distribution defect of Δeca1. Bar, 10 μm.
Figure 8.
Figure 8.
Analysis of a eca1 and dynein double mutant. (A) Morphology of Δeca1, dynts, and a Δeca1 dynts double mutant. At 30°C, Δeca1 cells grow irregular, branch, and display defects in cell separation, which results in cell chains (A1). At the restrictive temperature (30°C), dynts cells also show abnormal morphology, but cells tend to be longer and no cytokinesis defect was observed (A2). Under the same conditions, the double mutant showed an even stronger defect in cell shape (A3). Note that the morphology phenotype of the double mutant was very variable, ranging from branched cell chains to cells with long extensions. Bar, 10 μm. (B) Growth of Δeca1, dynts, and Δeca1 dynts mutants on agar plates. At permissive temperature (20°C), colony grow of all mutant strains was indistinguishable. However, at a semipermissive temperature (28°C), Δeca1 cells grow normal, whereas dynts mutants show impaired colony formation. Interestingly, these conditions are almost lethal for the Δeca1 dynts double mutant. This additive phenotype indicates that Δeca1 and dynein mutants are defective in different cellular processes and mutations in both confer synthetic lethality at restrictive temperature. (C) Microtubules in Δeca1, dynts, and Δeca1 dynts mutants. All mutant strains contained longer and irregular organized microtubules. Bar, 5 μm. (D) Parameters of MT dynamic instability in FB2ΔEca1Dyn2tsGT at restrictive conditions compared with the single mutant strain FB2ΔEca1GT (Δeca1, black bars). Note that rescue rates of the double mutant resemble that of the Δeca1 single mutant and only slight effects on catastrophe values, shrinkage, and growth velocities were found. These data demonstrate that inactivation of dynein does not increase the effect of Δeca1 on MTs, which argues for a role of EcaI and dynein in the same pathway to regulate microtubule dynamics. For measured numbers, see Table 2.
Figure 9.
Figure 9.
Model for the role of Eca1 in microtubule organization in U. maydis. (A) In wild-type cells, Eca1 is an ER-resident Ca2+ pump that maintains Ca2+ in the ER high and holds cytosolic Ca2+ below a toxic threshold (Ca2+cyt). MTs run along the axis of the cell to support directed MT-dependent delivery of supplies to the growth region. A fine-tuning of parameters of dynamic instability, including elongation and shrinkage velocities and catastrophe and rescue frequencies, controls most likely MT-length. (B) At 22°C, Δeca1 mutants display normal MTs and morphology suggesting that other Ca2+ pumps, such as a Cta4-like ATPse (for sake of clarity, not included) are sufficient to keep cytosolic Ca2+ levels low. However, the high sensitivity of Δeca1 mutants to ER stress suggests that [Ca2+]ER is at a lower limit. (C) Increased temperature results in protein misfolding in the ER, which activates Ca2+-dependent chaperones. This might induce store-mediated entry of extracellular Ca2+ through unknown channels, and Eca1 is required to pump this incoming Ca2+ into the ER, thereby maintaining [Ca2+]cyt at resting levels. (D) In the absence of Eca1, incoming Ca2+ cannot be stored away, thus cytosolic Ca2+ increases, which activates CaMKs. These kinases phosphorylate MT-associated factors that regulate MT organization by influencing MT dynamic instability. A potential target of CaMK is cytoplasmic dynein that regulates MT dynamic instability and supports MT-dependent motility. These alterations in dynein activity and MT organization lead to defects in polar secretion and abnormal morphogenesis. Note that this model is supported by several key observations: 1) lowering external Ca2+ prevents the ts-phenotype of Δeca1, 2) inhibition of CaMK restores MT-rescue values and leads to normal MT organization and morphology, and 3) artificially induced destabilization of MTs by benomyl treatment leads to significant reduction in morphology defects.

References

    1. Andersson, H., Kappeler, F., and Hauri, H.P. (1999). Protein targeting to endoplasmic reticulum by dilysine signals involves direct retention in addition to retrieval. J. Biol. Chem. 274, 15080-15084. - PubMed
    1. Bannuett, F., and Herskowitz, I. (1989). Different a alleles of Ustilago maydis are necessary for maintenance of filamentous growth but not for meiosis. Proc. Natl. Acad. Sci. USA 86, 5878-5882. - PMC - PubMed
    1. Benito, B., Garciadeblas, B., and Rodriguez-Navarro, A. (2000). Molecular cloning of the calcium and sodium ATPases in Neurospora crassa. Mol. Microbiol. 35, 1079-1088. - PubMed
    1. Bölker, M. (2001). Ustilago maydis - a valuable model system for the study of fungal dimorphism and virulence. Microbiology 147, 1395-1401. - PubMed
    1. Bonilla, M., Nastase, K.K., and Cunningham, K.W. (2002). Essential role of calcineurin in response to endoplasmic reticulum stress. EMBO J. 21, 2343-2353. - PMC - PubMed

Publication types

MeSH terms

LinkOut - more resources