. 2004 Jan 23;32(2):e18.
doi: 10.1093/nar/gnh013.

Rapid detection of single nucleotide polymorphisms associated with spinal muscular atrophy by use of a reusable fibre-optic biosensor

Affiliations

Rapid detection of single nucleotide polymorphisms associated with spinal muscular atrophy by use of a reusable fibre-optic biosensor

James H Watterson et al. Nucleic Acids Res. .

Abstract

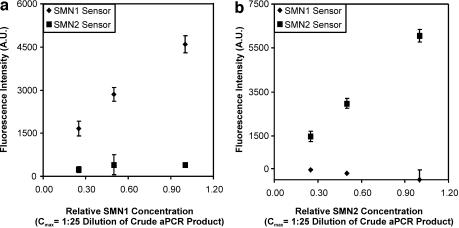
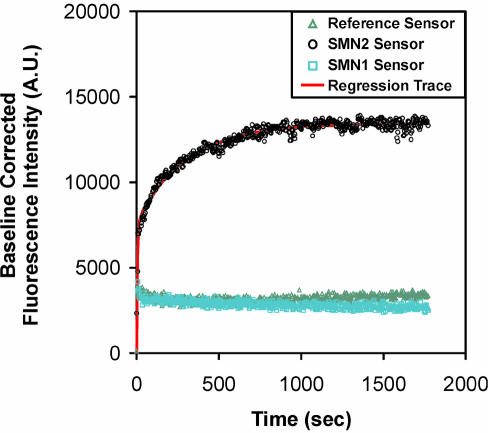
Rapid (<2 min) and quantitative genotyping for single nucleotide polymorphisms (SNPs) associated with spinal muscular atrophy was done using a reusable (approximately 80 cycles of application) fibre-optic biosensor over a clinically relevant range (0-4 gene copies). Sensors were functionalized with oligonucleotide probes immobilized at high density (approximately 7 pmol/cm2) to impart enhanced selectivity for SNP discrimination and used in a total internal reflection fluorescence detection motif to detect 202 bp PCR amplicons from patient samples. Real-time detection may be done over a range of ionic strength conditions (0.1-1.0 M) without stringency rinsing to remove non-selectively bound materials and without loss of selectivity, permitting a means for facile sample preparation. By using the time-derivative of fluorescence intensity as the analytical parameter, linearity of response may be maintained while allowing for significant reductions in analysis time (10-100-fold), permitting for the completion of measurements in under 1 min.


Figures

Figure 1
Figure 1
Schematic diagram of the four sensor flow cell. The inset displays the volume of bulk solution interrogated beyond the distal terminus of each optical fibre sensing element.
Figure 2
Figure 2
Normalized thermal denaturation profiles of the SMN1 and SMN2 sensor constructs. (a) Melt temperatures for the SMN1 probes with SMN1 target (complement sequence) (i) and SMN2 target (ii) were determined using 3 nM solutions of each Cy5-labeled target in 1× TEN (1 M NaCl, 50 mM Tris–HCl, 10 mM EDTA, pH 7.0). (b) Melt temperatures for the immobilized SMN2 probes with SMN1A (iii) and SMN2A (iv) were determined using the procedure stated above.
Figure 3
Figure 3
Selectivity of the optical biosensor functionalized with short oligonucleotide probes. Normalized thermal denaturation profiles of a sensor functionalized with SMN1 probes that were 12 nt in length following hybridization with SMN1A and SMN2A targets in 1× PBS.
Figure 4
Figure 4
Data processing steps for the optical nucleic acid biosensor. (a) Raw fluorescence data corresponding to the exposure of SMN1, SMN2 and reference sensors to solutions of PCR products of different composition; non-complementary DNA serving as a calibrant (i and ii); positive for SMN1 gene, negative for SMN2 gene (iii and vi); negative for SMN1 gene, positive for SMN2 gene (iv and vii); equal dosage in both SMN1 and SMN2 genes (v and viii). Crude PCR mixtures were diluted 1:25 in 1× TEN. (T = 58°C). (b) Partial correction of raw data in (a) by normalization of sensor for non-complementary DNA responses to that of the reference sensor. (c) Further correction of normalized SMN1 and SMN2 sensor responses by subtraction of non-selective signal component. (d) Time-derivative of reference-subtracted fluorescence data in (c).
Figure 5
Figure 5
Target concentration dependence of steady-state reference subtracted fluorescence intensities of SMN1 and SMN2 sensors. The concentration dependent fluorescence of SMN1 sensor and SMN2 sensor was monitored in the presence of PCR products representing either SMN1 (a) or SMN2 (b). In each case, solutions containing PCR amplicons of either single gene dosage in SMN1 or double gene dosage in SMN2 were diluted in 1× TEN (T = 58°C) to provide the appropriate concentration.
Figure 6
Figure 6
Chronofluorimetric profiles of SMN1, SMN2 and reference sensors. Samples were analyzed following introduction of a solution containing a diluted PCR mixture of SMN2 amplification product (1:25 dilution in 1× TEN, T = 58°C), along with the curve obtained from regression analysis of the selective binding response.

References

    1. Schena M. (1999) DNA Microarrays: A Practical Approach. Oxford University Press, New York, NY.
    1. Taton T.A., Mirkin,C.A. and Letsinger,R.L. (2000) Scanometric DNA array detection with nanoparticle probes. Science, 289, 1757–1760. - PubMed
    1. Yu C.J., Wan,Y., Yowanto,H., Li,J., Tao,C., James,M.D., Tan,C.L., Blackburn,G.F. and Meade,T.J. (2001) Electronic detection of single-base mismatches in DNA with ferrocene-modified probes. J. Am. Chem. Soc., 123, 11155–11161. - PubMed
    1. Fan J.B., Chen,X., Halushka,M.K., Berno,A., Huang,X., Ryder,T., Lipshutz,R.J., Lockhart,D.J. and Chakravarti,A. (2000) Parallel genotyping of human SNPs using generic high-density oligonucleotide Tag arrays. Genome Res., 10, 853–860. - PMC - PubMed
    1. Duggan D.J., Bittner,M., Chen,Y., Meltzer,P. and Trent,J.M. (1999) Expression profiling using cDNA microarrays. Nature Genet., 21, 10–14. - PubMed

Publication types

MeSH terms