

Circadian rhythm of dihydrouracil/uracil ratios in biological fluids: a potential biomarker for dihydropyrimidine dehydrogenase levels
- PMID: 14744810
- PMCID: PMC1574234
- DOI: 10.1038/sj.bjp.0705651
Circadian rhythm of dihydrouracil/uracil ratios in biological fluids: a potential biomarker for dihydropyrimidine dehydrogenase levels
Abstract
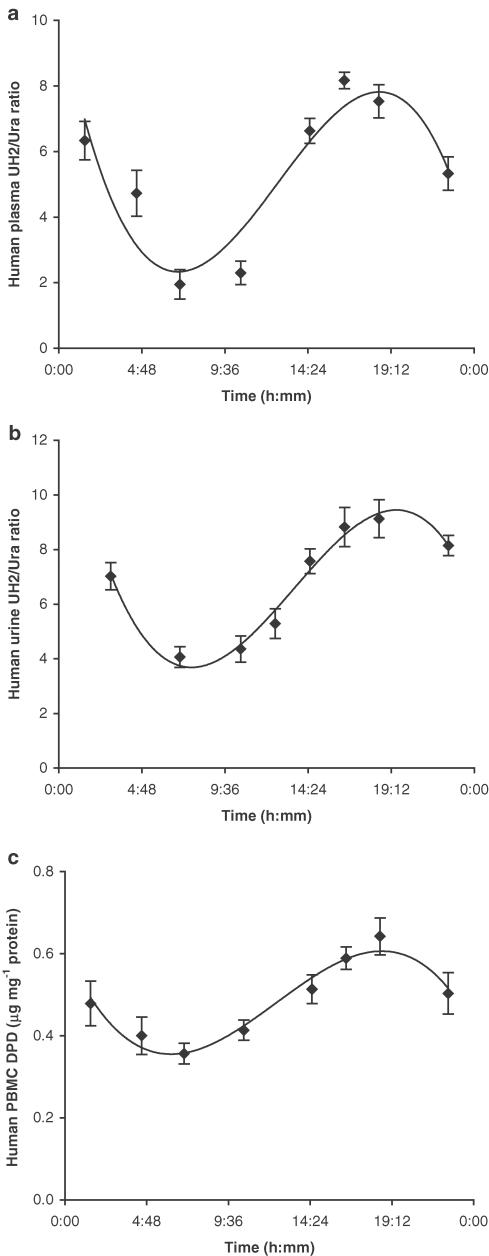
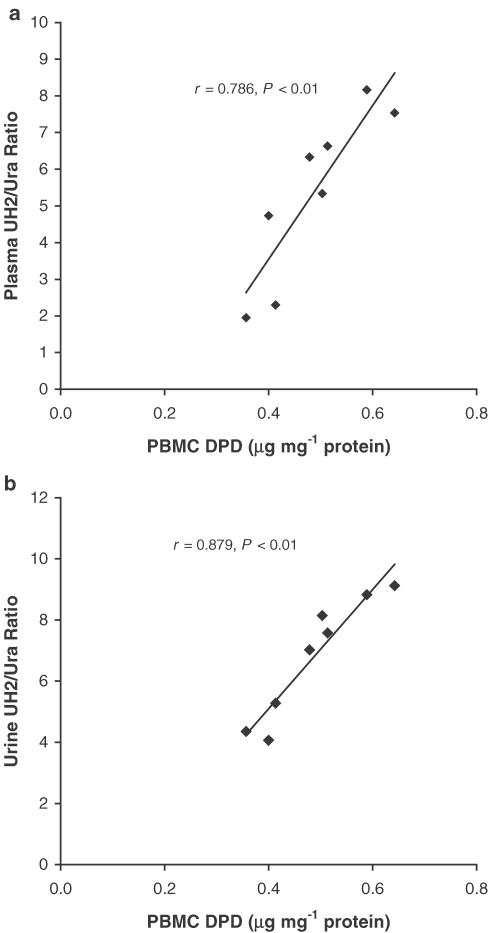
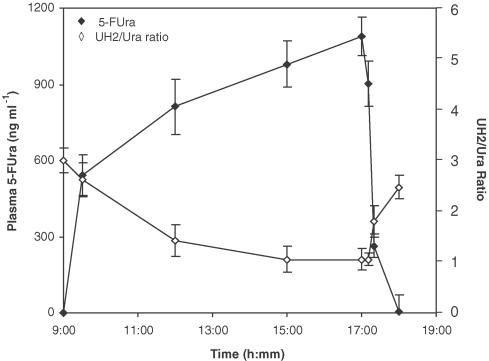
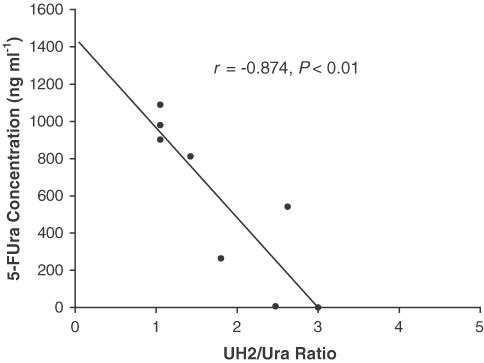
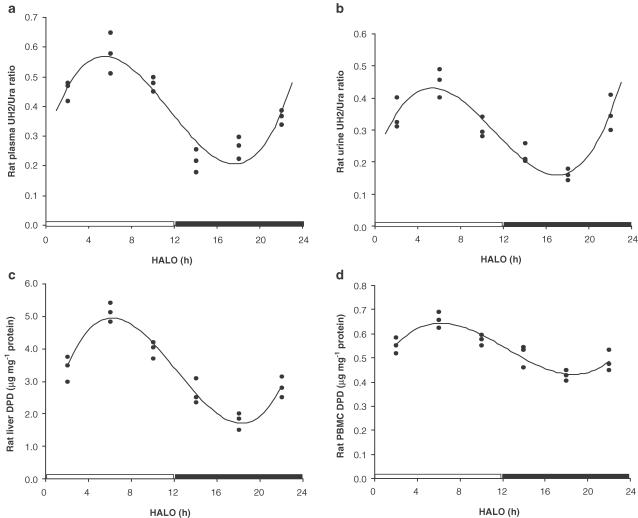
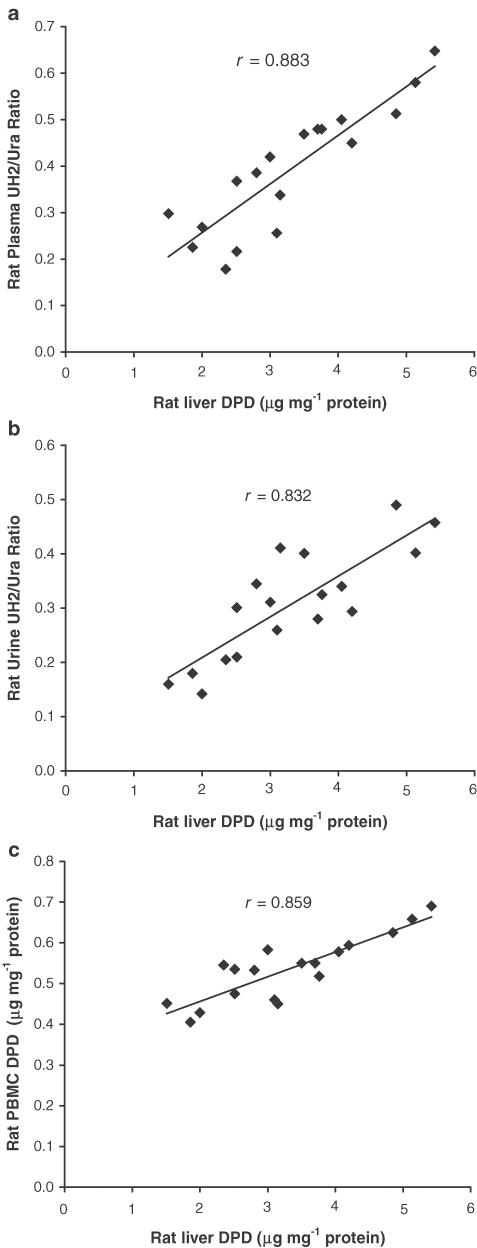
1. In many cancer patients, 5-fluorouracil (5-FUra) treatment is toxic and even causes death. Nevertheless, all patients are subjected to a standard therapy regimen because there is no reliable way to identify beforehand those patients who are predisposed to 5-FUra-induced toxicity. In this study, we identified the dihydrouracil/uracil (UH2/Ura) ratio in plasma or urine as a potential biomarker reflecting the activity of dihydropyrimidine dehydrogenase (DPD), the rate-limiting enzyme in 5-FUra metabolism. 2. UH2/Ura ratios were measured by high-performance liquid chromatography tandem triple quadrupole mass spectrometry (HPLC-MS/MS) in both healthy subjects (n=55) and in patients (n=20) diagnosed with grade I/II gestational trophoblastic tumours. In addition, rats (n=18) were used as an animal model to verify a correlation between UH2/Ura ratios and DPD levels in the liver. 3. A significant circadian rhythm was observed in UH2/Ura ratios in healthy subjects, whereas a disrupted rhythm occurred in cancer patients who were continuously infused with a high dose of 5-FUra. In rats, UH2/Ura ratios, liver DPD levels and PBMC DPD levels showed a definite circadian rhythm. Significant linear correlations with liver DPD levels were demonstrated for plasma UH2/Ura ratios (r=0.883, P<0.01), urine UH2/Ura ratios (r=0.832, P<0.01) and PBMC DPD levels (r=0.859, P<0.01). 4. The UH2/Ura ratio in biological fluid was significantly correlated with liver DPD levels; hence, this ratio could be a potential biomarker to identify patients with a deficiency in DPD.
Figures
References
-
- ASSMANN B., HAAS H.J. Determination of creatinine-related urinary uracil excretion in children by high-performance liquid chromatography. J. Chromatogr. 1990;525:277–285. - PubMed
-
- BARRAT M.A., RENEE N., MORMONT M.C., MILANO G., LEVI F. Circadian variations of dihydropyrimidine dehydrogenase (DPD) activity in oral mucosa of healthy volunteers. Pathol. Biol. (Paris) 2003;51:191–193. - PubMed
-
- BEUZEBOC P., PIERGA J.Y., LYONNET D.S., COUTURIER J., POUILLAR P. Severe 5-fluorouracil toxicity in a woman treated for breast cancer with concurrent osteogenesis imperfecta and dehydrogenase deficiency. Bull. Cancer. 1996;83:324–327. - PubMed
-
- BI D., ANDERSON L.W., SHAPIRO J., SHAPIRO A., GREM J.L., TAKIMOTO C.H. Measurement of plasma uracil using gas chromatography-mass spectrometry in normal individuals and in patients receiving inhibitors of dihydropyrimidine dehydrogenase. J. Chromatogr. B. 2000;738:249–258. - PubMed
-
- CHAU I., CHAN S., CUNNINGHAM D. Overview of preoperative and postoperative therapy for colorectal cancer: the European and United States perspectives. Clin. Colorectal Cancer. 2003;3:19–33. - PubMed
Publication types
MeSH terms
Substances
LinkOut - more resources
Full Text Sources
