. 2004 Feb 1;18(3):320-32.
doi: 10.1101/gad.1162204. Epub 2004 Jan 26.

Ovca1 regulates cell proliferation, embryonic development, and tumorigenesis

Affiliations

Ovca1 regulates cell proliferation, embryonic development, and tumorigenesis

Chun-Ming Chen et al. Genes Dev. .

Abstract

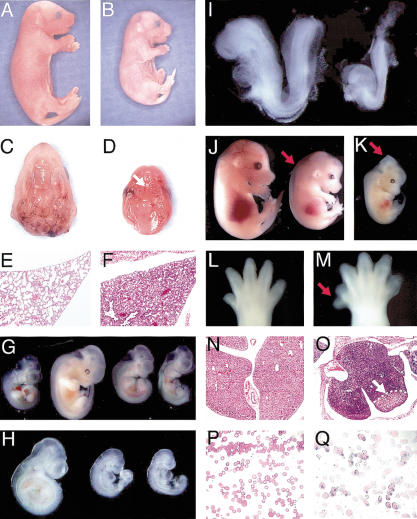
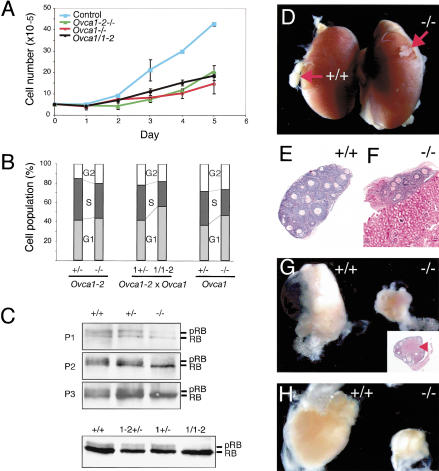
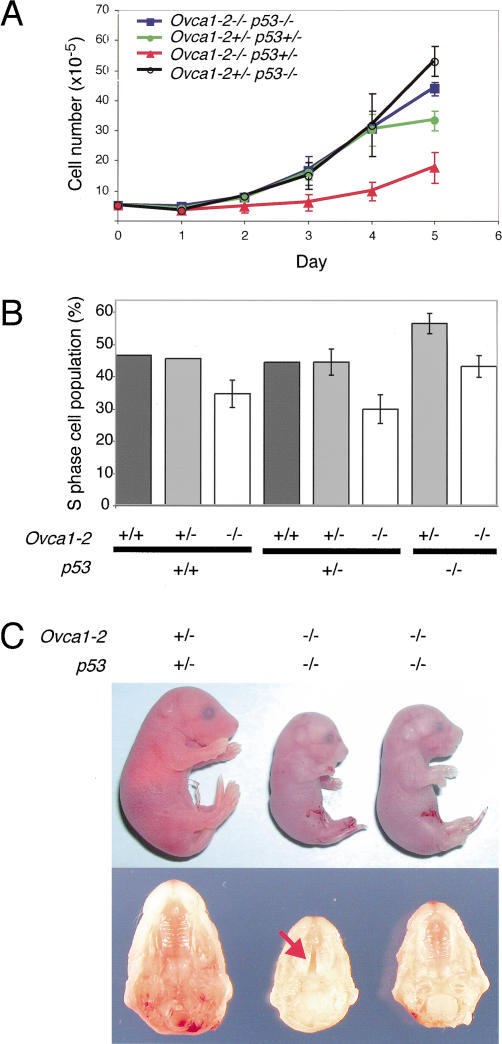
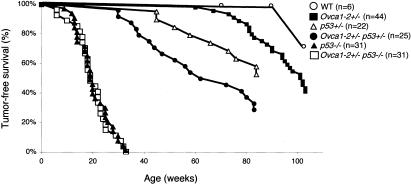
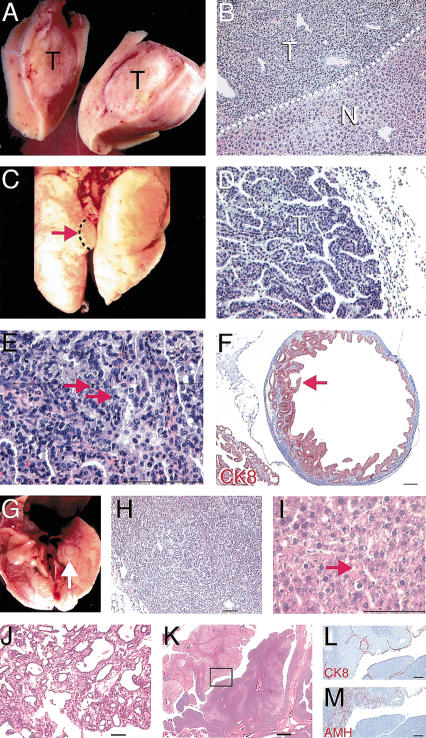
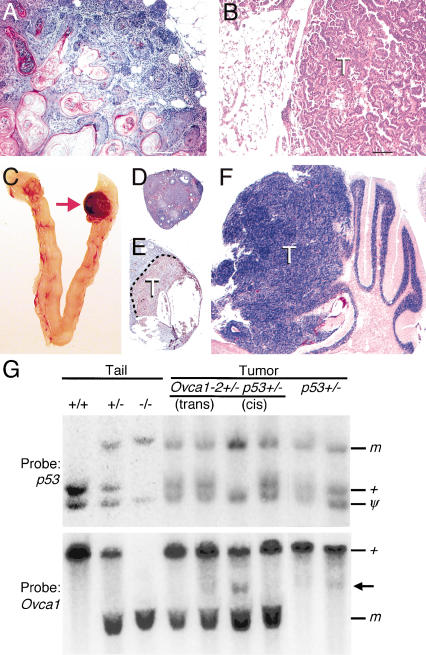
Loss of OVCA1/DPH2L1 correlates with ovarian and breast cancer. To study its in vivo role, we generated Ovca1 mutant alleles in mice. Ovca1 heterozygotes spontaneously develop cancer. Ovca1 mutant mice die during embryonic development and at birth with developmental delay and defects in multiple organ systems. Cell proliferation defects were observed in Ovca1 mutant mouse embryonic fibroblasts (MEFs). p53 deficiency can rescue these Ovca1 mutant MEF proliferation defects and partially rescue Ovca1 mutant embryonic phenotypes. Furthermore, Ovca1; p53 double heterozygotes developed tumors quicker than p53 heterozygotes and with an increased carcinoma incidence. Multiple tumor burden in Ovca1 heterozygotes that were also p53 deficient was significantly higher than in p53 homozygous mutants. These in vivo findings demonstrate that Ovca1 is a tumor suppressor that can modify p53-induced tumorigenesis and suggest that it acts as a positive regulator for cell cycle progression. The close linkage of OVCA1 and p53 on human Chromosome 17 suggests that coordinated loss may be an important mechanism for the evolution of ovarian, breast, and other tumor phenotypes.


Figures

Figure 1.
Figure 1.
Generation of Ovca1-2- and Ovca1-specific knockout mice. (A) Gene targeting strategy to generate Ovca1 mutant alleles. The Ovca1-Ovca2 locus is shown at the top. (Boxes) Exons; (light shaded boxes) Ovca1 coding region; (dark shaded boxes) Ovca2 coding region; (open boxes) untranslated sequences. (P1 to P5) Primers used for RT-PCR analysis and genotyping. The targeting vectors and resulting Ovca1-specific and Ovca1-2 mutant alleles with the neo expression cassette removed are shown below. (neo-flox) loxP-flanked neomycin resistant cassette; (tk) HSV thymidine kinase expression cassette; (3X stop) XbaI linker containing multiple stop codons; (H) HindIII; (N) NotI; (S) StuI; (X) XbaI; (Xh) XhoI. (B) RT-PCR analysis of Ovca1 expression in Ovca1-2+/+, Ovca1-2+/-, and Ovca1-2-/- MEFs. The P3 and P4 primers were used to amplify Ovca1 transcripts spanning exons 1 to 13. P4 and P5 were used to amplify Ovca1 transcripts spanning exons 1 to 6. (RT +) With reverse transcriptase; (RT -) without reverse transcriptase. (C) RT-PCR analysis of Ovca1 and Ovca2 expression in Ovca1+/+, Ovca1+/-, and Ovca1-/- MEFs. The P3 and P4 primers were used to detect Ovca1 expression. The primers P2 and P3 were used to amplify Ovca2 transcripts. (D) Western blot showing OVCA1 protein in multiple organs (brain, lung, liver, and kidney) of E18.5 Ovca1+/+ but not Ovca1-/- mice. Arrow, 50-kD OVCA1 protein.
Figure 2.
Figure 2.
Inactivation of Ovca1 or Ovca1-2 causes developmental abnormalities. Gross morphology of E18.5 (A) wild-type and (B) Ovca1-2-/- pups. Ventral view of palate of E18.5 (C) wild-type and (D) Ovca1-2-/- mice, showing cleft palate in the mutant (arrow). (E,F) H&E-stained histological sections of lung from E18.5 wild-type (E) and Ovca1-2-/- (F) pups. (G) E10.5-E11.5 embryos. E10.5 wild-type embryo (left); E11.5 wild-type embryo (second from left); two E11.5 Ovca1-2-/- embryos (right). (H) E9.5 embryos. Wild-type embryo (left); two Ovca1-2-/- embryos (right). (I) E8.5 embryos. Wild-type embryo (left); Ovca1-2-/- embryo (right). (J) E14.5 embryos. Wild-type embryo (left); Ovca1-/- embryo (right) with edema (arrow). (K) E13.5 Ovca1-2-/- embryo with midbrain exencephaly (arrow). (L) Hindlimb of an E14.5 wild-type embryo. (M) Preaxial polydactyly (arrow) in right hindlimb of E14.5 Ovca1-2-/- embryo. (N,O) H&E-stained histological sections of E16.5 fetal liver from wild-type (N) and Ovca1-2-/- (O) embryos. The mutant liver is highly basophilic and has a focal area of necrosis (arrow). (P,Q) Representative Wright-Giemsa-stained blood smears of E16.5 wild-type (P) and Ovca1-2-/- or Ovca1-/- (Q) embryos. Note that many of the mutant erythrocytes are nucleated.
Figure 3.
Figure 3.
Ovca1 mutant MEF cell cycle analysis and ovary grafts. (A) Growth dynamics of Ovca1 mutant MEFs. Genotypes are indicated in upper left corner: (Control) wild-type or Ovca1+/-. (B) Histogram showing the percentage of the MEF population in G1 (G0/G1), S, and G2 (G2/M). (C) Western blot showing RB and its phosphorylation (pRB) status in Ovca1 mutant MEFs. Analysis of passages 1 to 3 (P1, P2, P3) was derived from Ovca1+/+ (+/+), Ovca1+/- (+/-), and Ovca1-/- (-/-) embryos. Analysis of MEFs at passage 4 (P4) was derived from embryos obtained from Ovca1+/- × Ovca1-2+/- matings. (D) Gross morphology of Ovca1-2+/+ (+/+) and Ovca1-2-/- (-/-) ovaries (arrows) grown under the kidney capsule for 1 mo. (E,F) Histology of wild-type and Ovca1-2-/- ovary grafts shown in D. (G) Gross morphology of wild-type and Ovca1-2-/- ovaries grown in the ovarian bursa for 3 mo. (Inset) Histology of the 3-mo-old Ovca1-2-/- ovary graft. Corpus luteum (arrowhead) indicates ovulation. (H) Gross morphology of wild-type and Ovca1-2-/- ovaries grown in the ovarian bursa for 9 mo.
Figure 4.
Figure 4.
Effect of p53-deficiency on Ovca1 mutant MEF growth and embryo development. (A) Growth dynamics of Ovca1 mutant MEFs. Genotypes are indicated in the upper left corner. (B) Percentage of S-phase cell population derived from MEFs with various Ovca1 and p53 genotypes. Two to three independent MEF lines were analyzed (Ovca1-2+/+ p53+/+, n = 2; Ovca1-2+/- p53+/+, n = 2; Ovca1-2-/- p53+/+, n = 3; Ovca1-2+/+ p53+/-, n = 2; Ovca1-2+/- p53+/-, n = 3; Ovca1-2-/- p53+/-, n = 3; Ovca1-2+/- p53-/-, n = 3; Ovca1-2-/- p53-/-, n = 3). (C) Gross morphology of E18.5 cis Ovca1-2+/- p53+/- pup (left) and Ovca1-2-/- p53-/- pups (two pups on the right; top); normal palate fusion was found in 50% of Ovca1-2-/- p53-/- pups (n = 4; representative shown at right) in comparison to cleft palate (arrow) found in 50% of the same genotype (n = 4, representative shown in the middle). Normal palate morphology of representative cis Ovca1-2+/- p53+/- littermate (n > 4) is shown at the left as a control.
Figure 5.
Figure 5.
Tumor incidence in Ovca1 mutant mice.
Figure 6.
Figure 6.
Spontaneous tumor formation in Ovca1-2+/- and Ovca1+/- mice. (A) Tumor mass (T) found in the liver of an Ovca1-2+/- mouse. (B) H&E-stained section of tumor shown in A. Hepatocellular adenoma (T) showing basophilic, focal eosinophilic, and clear cell appearance with compression of the normal hepatic parenchyma (N). Dashed line indicates the boundary between tumor and normal hepatic parenchyma. Scale bar, 100 μm. (C) Tumor mass (arrow) found in the lung of an Ovca1-2+/- mouse. (D) H&E-stained section of bronchiolo-alveolar carcinoma (T) with mixed papillary and solid patterns shown in C. Scale bar, 100 μm. (E) Higher magnification of D, showing mitotic figures (arrowheads). (F) Cystadenoma found in the ovary of an Ovca1-2+/- mouse at 80 wk. Papillary-like epithelium immunostained for cytokeratin 8 (CK8, red) projects into the cyst, which is lined with tall columnar cells (arrow). Scale bar, 400 μm. (G) Tumor mass (arrow) found in a ventral lung lobe of an Ovca1+/- mouse at 78 wk of age. (H) H&E-stained section of tumor shown in G, showing a predominantly glandular arrangement of the tumor cells. (I) H&E-stained section of hepatocellular ademoma of an Ovca1+/- mouse at 66 wk of age. There is an abnormal presence of many hyaline bodies (arrow). Scale bar, 100 μm. (J) Mammary gland tumor found in an Ovca1+/- female at 70 wk of age. Adenocarcinoma type B was indicated because of collagenousstroma and glandular components consisting of focal cystic, hemorrhagic, and papillary growth patterns. Scale bar, 100 μm. (K) Tubular adenoma found in the ovary of an Ovca1+/- female at 82 wk of age. (Box) Region shown in L and M. Scale bar, 400 μm. (L) The neoplastic cells were lined by surface mesothelial cells which expressed CK8 (red). Scale bar, 100 μm. (M) AMH (red) was detected focally in the tumor. Scale bar, 100 μm.
Figure 7.
Figure 7.
Interaction between Ovca1 and p53 mutations for tumor formation. (A) H&E-stained section of a representative mammary gland adenosquamous carcinoma was found in two Ovca1-2+/- p53+/- mice at 38 and 78 wk of age. There are keratinized well-differentiated squamous cells surrounded by the glandular elements of the mammary gland. Scale bar, 100 μm. (B) H&E-stained section shows a bronchiolo-alveolar carcinoma with a papillary growing pattern in an Ovca1-2+/- p53+/- male mouse at 80 wk of age. Scale bar, 100 μm. (C) Reproductive tract from an Ovca1-2+/- p53-/- female mouse at 33 wk of age. One ovary (arrow) shown at the right is enlarged and hemorrhagic. H&E-stained sections of ovaries shown in C with normal histology (D) and a hemangiosarcoma immunostained with CD34 (brown; E). (F) H&E-stained section of a brain tumor (T) showing a transition from the cerebellar granular layer to a neoplastic appearance reminiscent of human medulloblastoma, replacing the cerebellar folia. (G) Southern blot analysis of p53 and Ovca1 in tumors from Ovca1-2+/- p53+/- and p53+/- mice. Tail DNA from wild-type (+/+), cis Ovca1-2+/- p53+/- (+/-), and Ovca1-2-/- p53-/- (-/-) mice. Genomic DNA from individual tumors, including trans Ovca1-2+/- p53+/-, cis Ovca1-2+/- p53+/-, and p53+/-. (m) Mutant allele; (+) wild-type allele; (ψ) p53 pseudogene. One cis Ovca1-2+/- p53+/- tumor shows LOH of the p53 locus and an additional minor band (arrow), suggesting a rearrangement of the Ovca1 locus in a subset of cells in the tumor.

Comment in

References

    1. Atalay A., Crook, T., Ozturk, M., and Yulug, I.G. 2002. Identification of genes induced by BRCA1 in breast cancer cells. Biochem. Biophys. Res. Commun. 299: 839-846. - PubMed
    1. Bast R.C. and Mills, G.B. 2000. Alterations in oncogenes, tumor suppressor genes, and growth factors associated with epithelial ovarian cancers. In Ovarian cancer: Methods and protocols (ed. J.M.S. Bartlett), pp. 37-48. Humana Press, Totowa, NJ. - PubMed
    1. Blackburn A.C., Brown, J.S., Naber, S.P., Otis, C.N., Wood, J.T., and Jerry, D.J. 2003. BALB/c alleles for Prkdc and Cdkn2a interact to modify tumor susceptibility in Trp53+/- mice. Cancer Res. 63: 2364-2368. - PubMed
    1. Bruening W., Prowse, A.H., Schultz, D.C., Holgado-Madruga, M., Wong, A., and Godwin, A.K. 1999. Expression of OVCA1, a candidate tumor suppressor, is reduced in tumors and inhibits growth of ovarian cancer cells. Cancer Res. 59: 4973-4983. - PubMed
    1. Cao L., Li, W., Kim, S., Brodie, S.G., and Deng, C.X. 2003. Senescence, aging, and malignant transformation mediated by p53 in mice lacking the Brca1 full-length isoform. Genes & Dev. 17: 201-213. - PMC - PubMed

Publication types

Substances