. 2004 Feb 2;164(3):361-71.
doi: 10.1083/jcb.200311063. Epub 2004 Jan 26.

Mating type-dependent constraints on the mobility of the left arm of yeast chromosome III

Affiliations

Mating type-dependent constraints on the mobility of the left arm of yeast chromosome III

Debra A Bressan et al. J Cell Biol. .

Abstract

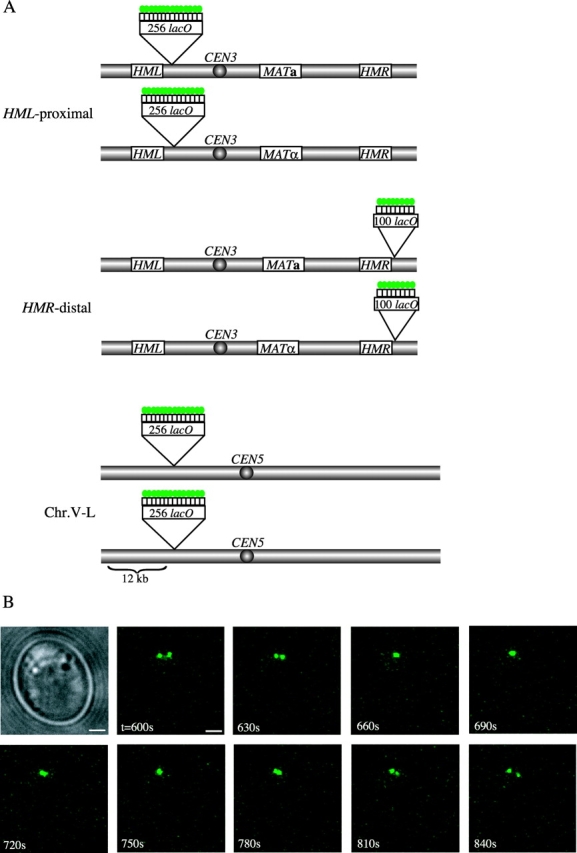
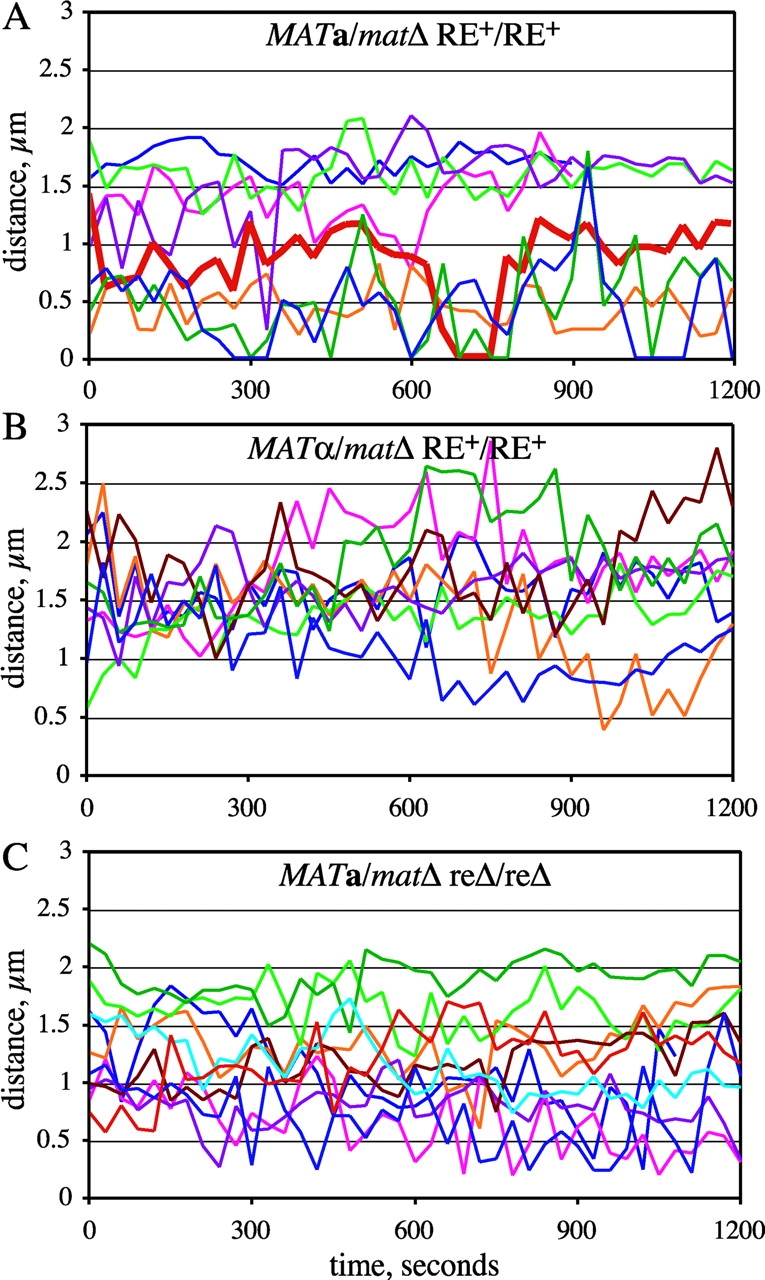
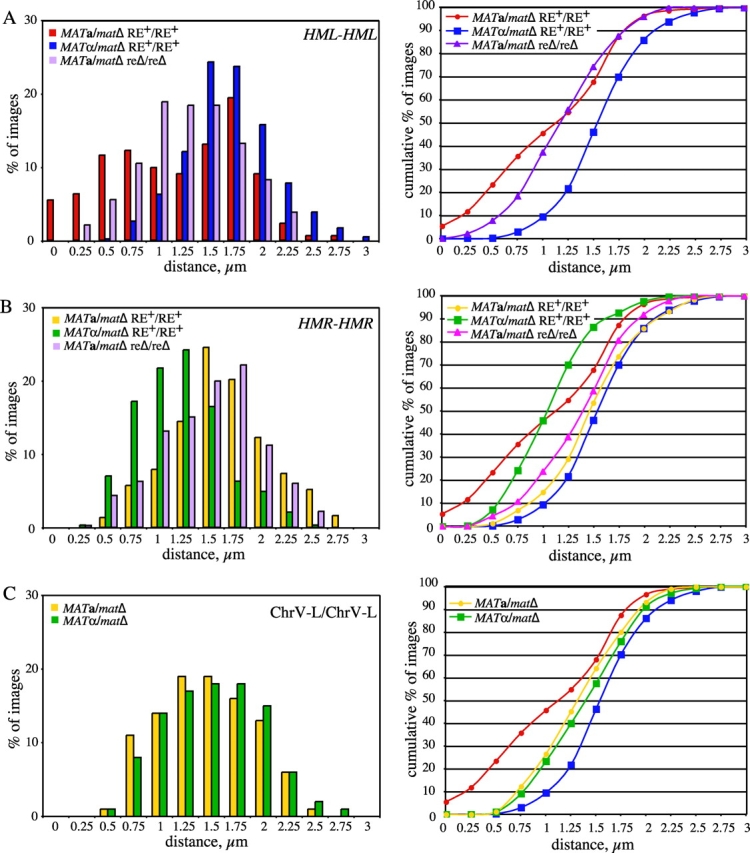
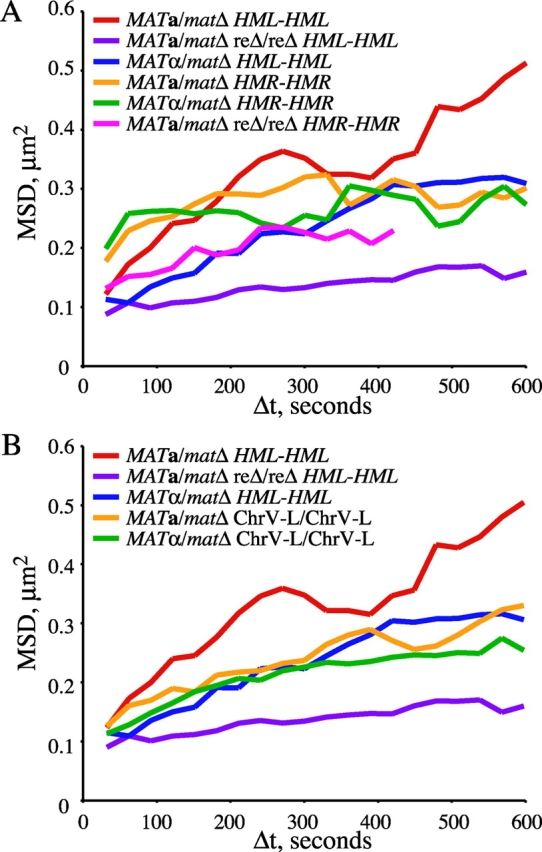
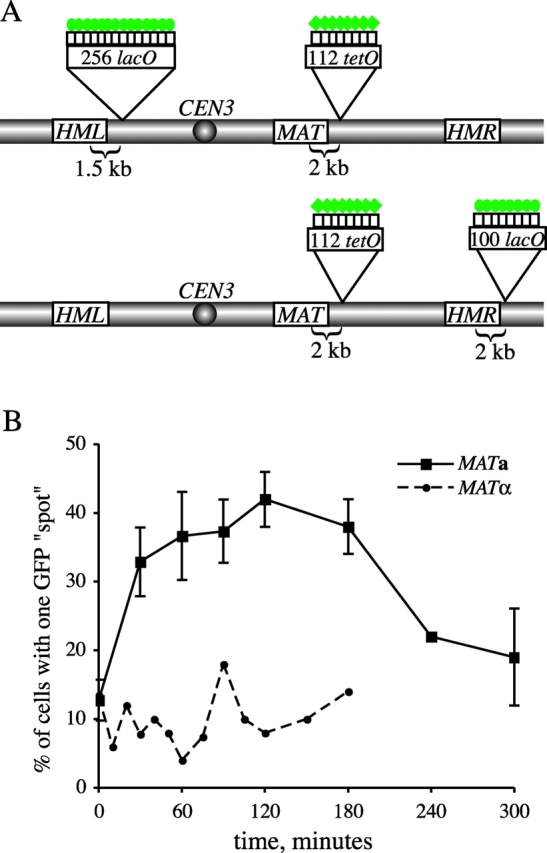
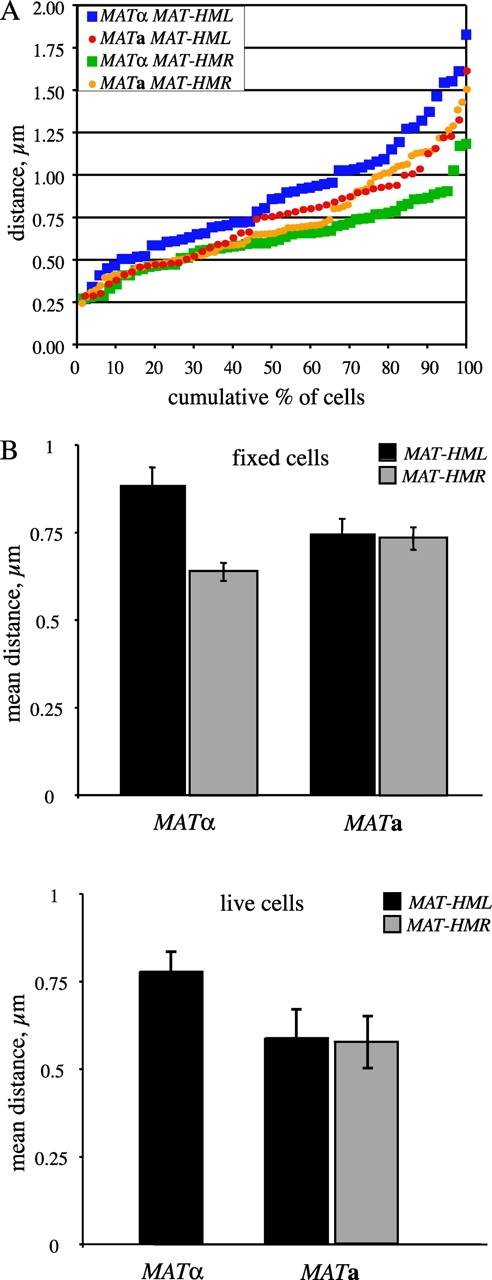
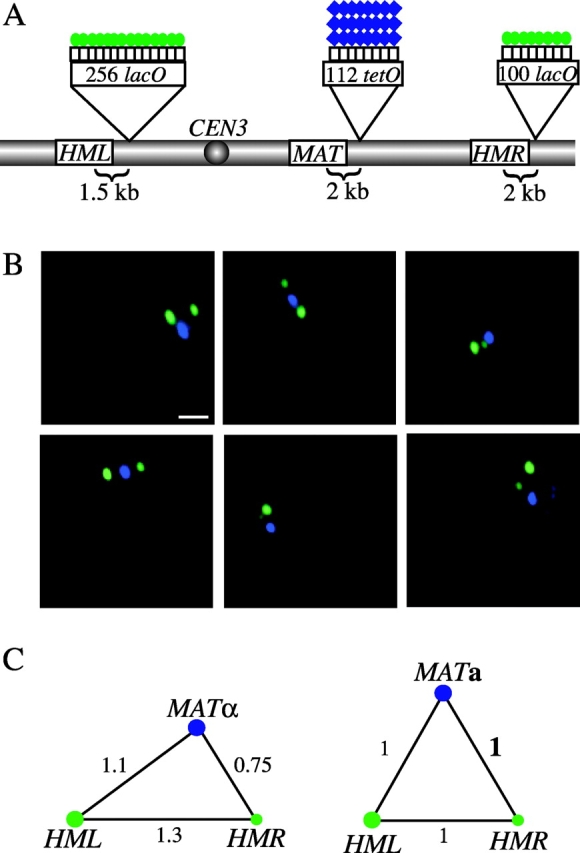
Mating-type gene (MAT) switching in budding yeast exhibits donor preference. MATa preferentially recombines with HML near the left telomere of chromosome III, whereas MATalpha prefers HMR near the right telomere. Donor preference is controlled by the recombination enhancer (RE) located proximal to HML. To test if HML is constrained in pairing with MATalpha, we examined live-cell mobility of LacI-GFP-bound lactose operator (lacO) arrays inserted at different chromosomal sites. Without induction of recombination, lacO sequences adjacent to HML are strongly constrained in both MATalpha and RE-deleted MATa strains, compared with MATa. In contrast, chromosome movement at HMR or near a telomere of chromosome V is mating-type independent. HML is more constrained in MATa Deltare and less constrained in MATa RE+ compared with other sites. Although HML and MATa are not prealigned before inducing recombination, the three-dimensional configuration of MAT, HML, and HMR is mating-type dependent. These data suggest there is constitutive tethering of HML, which is relieved in MATa cells through the action of RE.


Figures

Figure 1.
Figure 1.
Visualization of GFP-tagged allelic loci in living diploid cells. (A) Sites of lacO array insertions on the left (HML-proximal) and right (HMR-distal) arms of chromosome III and on the left arm of chromosome V (Chr.V-L) are indicated. Pairs of tagged chromosomes represent homologues in diploid strains. Green circles represent LacI-GFP fusion proteins bound to the operator arrays. (B) Nuclei of live unbudded cells were observed at 30-s intervals for 20 min using 3D deconvolution fluorescence microscopy. Brightfield and GFP images for several consecutive time points for one MAT a /matΔ cell bearing HML-proximal GFP tags (YDB093) are shown. Time (seconds) after the start of observation is indicated. Images are projections of 16 sections spaced 0.2 μm apart. We note that although these images are projections, the apparent convergence of the two foci from t = 660 s to t = 750 s actually represents the overlap of the foci in 3D space, whereas the projected image from t = 780 s falsely depicts the pairing of these tagged sites. The time-series plot of the distance between the foci over time for this cell is indicated by a thick red line in Fig. 2 A. Bars, 1 μm.
Figure 2.
Figure 2.
Mobility of GFP-tagged allelic loci on the left arm of chromosome III. Nuclei of live unbudded diploid cells tagged adjacent to the HML locus on the left arm of chromosome III were imaged as in Fig. 1 B. For each time point, the distance between the two GFP foci was determined from 3D images and is plotted here versus time. Each colored line represents distance data from a single cell. The thick red line in A corresponds to the images shown in Fig. 1 B. Strains used: (A) MAT a /matΔ RE+/RE+ (YDB092 and YDB093); (B) MATα/matΔ RE+/RE+ (YDB090 and YDB091); and (C) MAT a /matΔ reΔ/reΔ (YDB142 and YDB143).
Figure 3.
Figure 3.
Association of allelic loci on chromosomes III and V. Nuclei of live unbudded diploid cells tagged at allelic HML-proximal, HMR-distal, or Chr.V-L loci were imaged as in Fig. 1 B, and the distance between the two GFP foci was determined from 3D images for each time point. A total of at least 328 images were obtained from 8–17 independent nuclei per strain. Distributions of distances between the foci are presented on the left. Cumulative percentage of images versus distance is plotted on the right. Data for the MAT a /matΔ and MATα/matΔ strains tagged at HML-proximal loci are replotted in B and C. Strains used: (A) HML-proximal (from data plotted in Fig. 2, except MAT a /matΔ RE+/RE+ includes data from an additional nine nuclei not shown in Fig. 2 A): MAT a /matΔ RE+/RE+ (YDB092 and YDB093); MATα/matΔ RE+/RE+ (YDB090 and YDB091); MAT a /matΔ reΔ/reΔ (YDB142 and YDB143). (B) HMR-distal: MAT a /matΔ RE+/RE+ (YDB191); MATα/matΔ RE+/RE+ (YDB192 and YDB194); MATα//matΔ reΔ/reΔ (YDB248). (C) Chr.V-L: MAT a /matΔ (YDB214); MATα/matΔ (YDB238).
Figure 4.
Figure 4.
Chromosomal locus confinement is mating-type dependent. MSD values for tagged allelic loci is shown for the time intervals (Δt) indicated. The degree of constraint is proportional to the height of the plateau of the MSD curve. Strains are the same as in Fig. 3. (A) Strains tagged at allelic HML-proximal loci (MAT a /matΔ RE+/RE+, YDB092 and YDB093; MATα/matΔ RE+/RE+, YDB090 and YDB091; MAT a /matΔ reΔ/reΔ, YDB142 and YDB143) and HMR-distal loci (MAT a /matΔ RE+/RE+, YDB191; MATα/matΔ RE+/RE+, YDB192 and YDB194; MATα/matΔ reΔ/reΔ, YDB248). MSD values for Δt >420 s could not be calculated from strain YDB248 distance data due to bleaching of the GFP foci at late times during the time courses. (B) Strains tagged at allelic loci on the left arm of chromosome V (MAT a /matΔ, YDB214; MATα/matΔ, YDB238) and HML-proximal loci (replotted from A for comparison).
Figure 5.
Figure 5.
Visualization of mating-type loci before and after HO induction. (A) Sites of lacO and tetO array insertions along chromosome III are indicated. Green circles and diamonds represent LacI-GFP and TetR-GFP fusion proteins, respectively, bound to the operator arrays. (See Materials and methods for detailed descriptions of the constructs used for chromosomal integrations.) (B) Plot of cells exhibiting pairing of GFP-tagged HML and MAT loci in MAT a (YDB112, squares) versus MATα (YDB111, circles) cells. HO endonuclease was induced at t = 0 min by addition of galactose to the media and turned off at t = 30 min by the addition of glucose (2% final concentration). Cells were fixed at time points indicated and scored for the appearance of one versus two GFP spots per nucleus by fluorescence microscopy. At least 50 cells of each mating-type were scored per time point. For the MAT a strain, average values from two independent experiments are plotted with standard deviation represented by error bars. The efficiency of MAT switching in this assay, as determined from mating-type tests of plated cells, was found to be ∼60%.
Figure 6.
Figure 6.
Distance between the MAT locus and the HML and HMR donor loci in haploid cells. Haploid cells bearing GFP tags adjacent to the MAT locus and either HML (YDB111, MATα; YDB112, MAT a) or HMR (YDB229, MATα; YDB228 and YDB239, MAT a) were grown in liquid culture to exponential phase and imaged using 3D deconvolution fluorescence microscopy. The distance between the nuclear GFP foci was calculated from at least 50 3D images per strain for each GFP-tagged locus pair (see Materials and methods for a detailed description of this analysis). (A) Distances between MAT and HML or HMR are plotted as cumulative percentages of cells with two GFP foci for MAT a (circles) and MATα (squares) strains. Cells were fixed in PFA before imaging. (B) Bar graph of the mean distance between MAT and each donor locus in MAT a and MATα cells. Top, fixed cells; bottom, live cells. Error bars represent standard error.
Figure 7.
Figure 7.
3D positioning of tagged mating-type loci by fluorescence microscopy. (A) Sites of lacO and tetO array insertions along chromosome III are indicated. Green circles and blue diamonds represent LacI-GFP and TetR-(CFP)3 fusion proteins, respectively, bound to the operator arrays. (B and C) GFP/CFP-tagged haploid cells (YDB242 and YDB243) were grown in liquid culture to exponential phase, fixed in PFA, and imaged using 3D deconvolution fluorescence microscopy. (B) Images shown are projections of 16 optical sections per wavelength spaced 0.2 μm apart. Image sections were obtained by alternate excitation with light of each wavelength and were pseudocolored (GFP, green; CFP, blue) after deconvolution. The differently sized GFP-bound arrays adjacent to the HML and HMR loci are distinguished by the relative sizes of the observed GFP (green) foci. Bar, 1 μm. (C) Diagrams of the calculated 3D configuration of tagged loci in MATα (YDB242) and MAT a (YDB243) cells. Mean distance measurements for each pairwise combination of loci were calculated from 11–22 cells per mating-type and the relative positioning of the three tagged loci, represented by blue and green circles, is shown. Numbers represent mean distances between loci normalized to the distance between MAT and HMR in the MAT a strain (indicated as a bold number 1). Actual distance values are given in the text.

References

    1. Agard, D.A., Y. Hiraoka, P. Shaw, and J.W. Sedat. 1989. Fluorescence microscopy in three dimensions. Methods Cell Biol. 30:353–377. - PubMed
    1. Belmont, A.S. 2001. Visualizing chromosome dynamics with GFP. Trends Cell Biol. 11:250–257. - PubMed
    1. Chen, H., D.D. Hughes, T.A. Chan, J.W. Sedat, and D.A. Agard. 1996. IVE (Image Visualization Environment): a software platform for all three-dimensional microscopy applications. J. Struct. Biol. 116:56–60. - PubMed
    1. Dekker, J., K. Rippe, M. Dekker, and N. Kleckner. 2002. Capturing chromosome conformation. Science. 295:1306–1311. - PubMed
    1. Fung, J.C., W.F. Marshall, A. Dernburg, D.A. Agard, and J.W. Sedat. 1998. Homologous chromosome pairing in Drosophila melanogaster proceeds through multiple independent initiations. J. Cell Biol. 141:5–20. - PMC - PubMed

Publication types

MeSH terms

Substances