Comparative Study
. 2004 Feb;86(2):665-80.
doi: 10.1016/S0006-3495(04)74146-6.

Proton transfer dynamics at the membrane/water interface: dependence on the fixed and mobile pH buffers, on the size and form of membrane particles, and on the interfacial potential barrier

Affiliations
Comparative Study

Proton transfer dynamics at the membrane/water interface: dependence on the fixed and mobile pH buffers, on the size and form of membrane particles, and on the interfacial potential barrier

Dmitry A Cherepanov et al. Biophys J. 2004 Feb.

Abstract

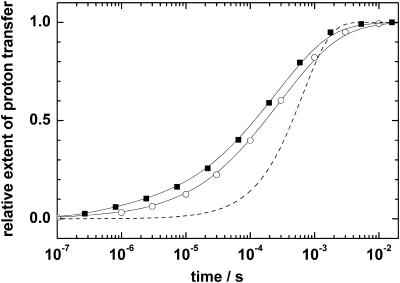
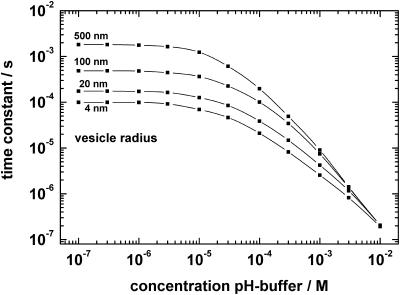
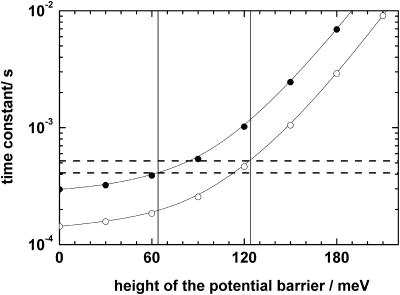
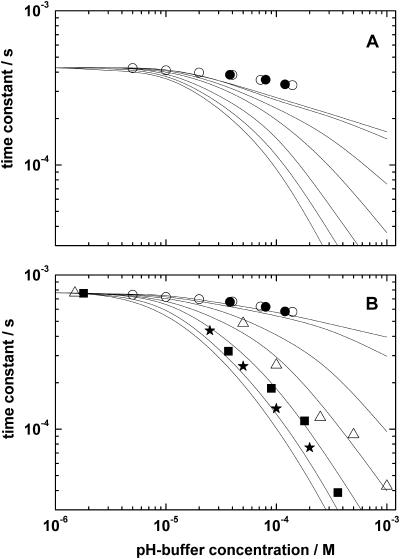
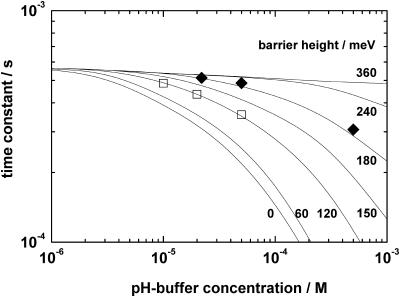
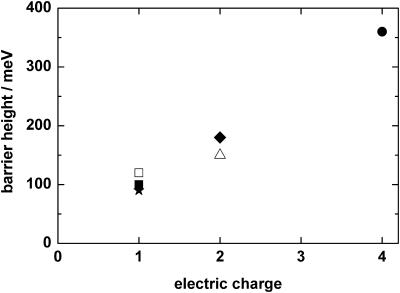
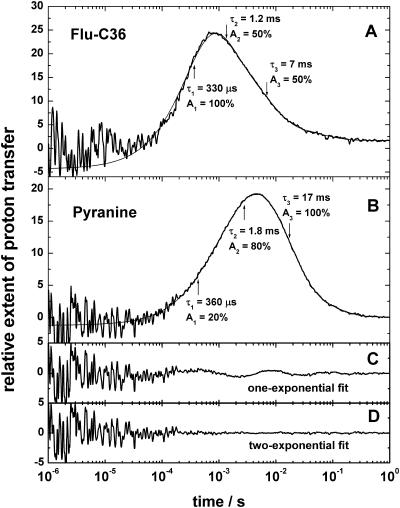
Crossing the membrane/water interface is an indispensable step in the transmembrane proton transfer. Elsewhere we have shown that the low dielectric permittivity of the surface water gives rise to a potential barrier for ions, so that the surface pH can deviate from that in the bulk water at steady operation of proton pumps. Here we addressed the retardation in the pulsed proton transfer across the interface as observed when light-triggered membrane proton pumps ejected or captured protons. By solving the system of diffusion equations we analyzed how the proton relaxation depends on the concentration of mobile pH buffers, on the surface buffer capacity, on the form and size of membrane particles, and on the height of the potential barrier. The fit of experimental data on proton relaxation in chromatophore vesicles from phototropic bacteria and in bacteriorhodopsin-containing membranes yielded estimates for the interfacial potential barrier for H(+)/OH(-) ions of approximately 120 meV. We analyzed published data on the acceleration of proton equilibration by anionic pH buffers and found that the height of the interfacial barrier correlated with their electric charge ranging from 90 to 120 meV for the singly charged species to >360 meV for the tetra-charged pyranine.


Figures

FIGURE 1
FIGURE 1
Calculated time course of surface/bulk proton equilibration in flat cylindrical membrane sheets (▪) and spherical vesicles (○) of the same surface area. The radius of sheets and vesicles was 500 and 354 nm, respectively; the surface capacity of fixed buffer was 7.4 × 10⁻⁸ mol m−2; the concentration of mobile buffer (pK = 7.2) was 100 μM; the diffusion coefficient of mobile buffer was 2 × 10⁻⁶ cm2 s−1, pH 7.2. The dashed line represents the monoexponential kinetics with the time constant calculated for the same parameters as Eq. 6.
FIGURE 2
FIGURE 2
Dependence of proton relaxation time on the concentration of added mobile pH buffer as calculated for vesicles of various size. The radii in nm are indicated at the left of the curves; the diffusion coefficients of H+/OH ions and of the mobile buffer were 10−4 cm2 s−1 and 2 × 10⁻⁶ cm2 s−1, respectively; the potential barrier was 60 meV, both for the H+/OH ions and for the mobile pH buffer.
FIGURE 3
FIGURE 3
Estimation of the interfacial potential barrier for H+/OH ions from the rate of BCP protonation in chromatophores of Rb. sphaeroides. The dependence of the proton relaxation time on the barrier height was calculated as described in the text using the surface buffer capacity of 1.2 × 10⁻⁷ mol m−2 (○) and 2.8 × 10⁻⁷ mol m−2 (•) and taking the thickness of the interfacial layer of 2 nm and the diffusion coefficient of H+/OH ions of 10−4 cm2s−1. The chromatophore radius of 18 nm was assumed at calculations. The experimentally determined time constant of proton relaxation in chromatophores from Rb. sphaeroides (450 ± 50 μs) is shown by dashed horizontal lines. Vertical lines mark the interval for the estimated potential barrier of 65–125 meV consistent with the experimental data.
FIGURE 4
FIGURE 4
Dependence of proton relaxation time on the concentration of added mobile buffer. Each set of seven theoretical curves was calculated for various heights of potential barrier for mobile buffer, formula image (the values formula image = 0, 60, 120, 150, 180, 240, and 360 meV correspond to the curves plotted sequentially from the left to the right) at a given value of the potential barrier formula image for H+ ions. All curves were calculated for vesicles of 100 nm radius and for the surface buffer capacity of 7.4 × 10⁻⁸ mol m−2, pH 7.2. The time constants of experimentally measured pyranine protonation by the BR-ejected protons are shown by circles (solid circles represent the data from Porschke (2002) and open circles correspond to data from Heberle (1991)). (A) formula image. The response time of p-nitrophenol (Drachev et al., 1984) is shown by stars, the acceleration of proton relaxation (as measured by pyranine) by added MES (Porschke, 2002) and phosphate (Grzesiek and Dencher, 1986) is shown by squares and triangles, respectively. In the case of MES, the effective buffer capacity at the ambient pH of 7.45 was recalculated by using the buffer pK value of 6.2. The diffusion coefficient of H3O+/OH ions and of the mobile buffer were assumed to be 10−4 cm2 s−1 and 2 × 10⁻⁶ cm2 s−1, respectively. The response time of indicators in the bulk was recalculated from the experimental kinetics by accounting for the time needed by BR to eject a proton under given experimental conditions.
FIGURE 5
FIGURE 5
Acceleration of the proton relaxation in chromatophores from Rb. sphaeroides by mobile buffers. The response time of BCP is shown by circles and the acceleration of the 20-μM BCP response by MES is shown by squares (the experimental data were taken from Gopta et al. (1999) and corrected for the time of proton transfer from the surface to QB of 100 μs); the set of seven curves was calculated for the various heights of the potential barrier for mobile buffer formula image = 0, 60, 120, 150, 180, 240, and 360 meV correspond to the curves plotted sequentially from the left to the right) using the potential barrier for H+/OH ions formula image.
FIGURE 6
FIGURE 6
The height of interfacial barrier for five anionic pH buffers/indicators as function of their electric net charge in the deprotonated state. The barrier height was determined from the ability of buffers to accelerate proton equilibration at the membrane surface as described in the text. The symbols match those used in Figs. 4 B and 5.
FIGURE 7
FIGURE 7
The multiexponential deconvolution of the proton relaxation kinetics at BR membranes (the kinetic traces were taken from Heberle et al. (1994)). (A) Proton binding to fluorescein covalently attached to the residue 36 in BR, replotted from Fig. 2 b in Heberle et al. (1994). (B) Proton binding to pyranine in solution (the same sample as in Fig. 7 A, replotted from Fig. 2 d in Heberle et al. (1994)). (C) Residual of the one-exponential fit of the proton binding to pyranine in Fig. 7 B. (D) Residual of the two-exponential fit of the proton binding to pyranine in Fig. 7 B.

Similar articles

Cited by

References

    1. Alexiev, U., R. Mollaaghababa, P. Scherrer, H. G. Khorana, and M. P. Heyn. 1995. Rapid long-range proton diffusion along the surface of the purple membrane and delayed proton transfer into the bulk. Proc. Natl. Acad. Sci. USA. 92:372–376. - PMC - PubMed
    1. Arata, H., I. Takenaka, and M. Nishimura. 1987. Flash-induced proton release in Rhodopseudomonas sphaeroides spaeroplasts. J. Biochem. 101:261–265. - PubMed
    1. Baur, J. E., and R. M. Wightman. 1991. Diffusion-coefficients determined with microelectrodes. J. Electroanal. Chem. 305:73–81.
    1. Bell, R. P. 1973. The Proton in Chemistry. Chapman & Hall, London, UK.
    1. Berry, R. S., S. A. Rice, and J. Ross. 1980. Physical Chemistry. Wiley, New York.

MeSH terms

LinkOut - more resources