

doi: 10.1016/S0006-3495(04)74153-3.
Dynamics of pinned membranes with application to protein diffusion on the surface of red blood cells
Affiliations
- PMID: 14747313
- PMCID: PMC1303925
- DOI: 10.1016/S0006-3495(04)74153-3
Item in Clipboard
Dynamics of pinned membranes with application to protein diffusion on the surface of red blood cells
Biophys J.
2004 Feb.
Abstract
We present a theoretical treatment and simulation algorithm for the dynamics of Helfrich elastic membrane surfaces in the presence of general harmonic perturbations and hydrodynamic coupling to the surrounding solvent. In the limit of localized and strong interactions, this harmonic model can be used to pin the membrane to intracellular/intercellular structures. We consider the case of pinning to the cytoskeleton and use such a model to estimate the macroscopic diffusion constant for band 3 protein on the surface of human erythrocytes. Comparison to experimental results suggests that thermal undulations of the membrane surface should play a significant role in protein mobility on the red blood cell.
Figures

Schematic illustration of the behavior of transmembrane proteins in the red blood cell (the matrix or skeleton fence model). The cytoskeleton immediately below the membrane hinders protein transport by confining the protein temporarily to a localized corral (a). Jumps from one corral to another occur slowly and have previously been postulated to result from dynamic reorganization of the cytoskeletal matrix, by (b) dissociation of spectrin tetramers, (c) thermal fluctuations in the shape of the cytoskeleton, or (d) infrequent crossing events where the protein is thermally kicked hard enough to force its way over a relatively static cytoskeleton. This study considers a different possibility—that shape fluctuations of the lipid bilayer may allow for corral hopping (e).
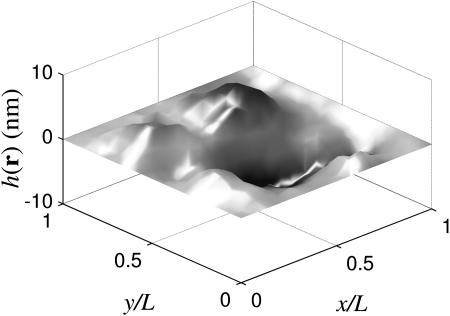
Membrane configuration for a square sheet pinned along the border of the simulation box (ℒ = 112 nm) and using physical parameters (Kc,η,T,γ) from Table 1. Notice that half of the membrane is above the plane and half is below, as expected for hk=0 = 0.

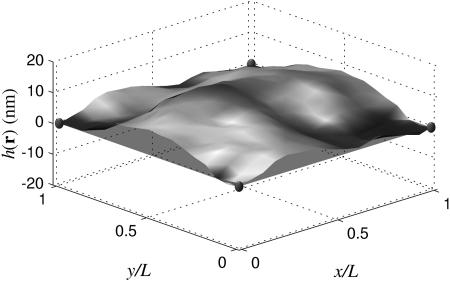
Membrane configuration with L = 112 nm embedded in a larger system of size ℒ = 3L (the rest of the system outside of the corral is not shown). The pinning occurs at the corners at z = 0, and at the center of the corral at a height of z = 40 nm (small spheres indicate pinning sites). Note that the entire system must have its center of mass at zero, but within this corral, the center of mass is clearly above zero.

Time evolution of both a free (top) and pinned membrane (bottom) of corral length ℒ = L = 112 nm using the physical parameters for a red blood cell listed in Table 1. The membrane configuration is constructed by sampling from Eqs. 15 and 16, reconstructing the Fourier modes, and inverse transforming. The red spheres are located at points where the membrane has been explicitly pinned. The long wavelength modes relax at a slower rate compared to the short wavelength modes as expected from the free membrane results in Eq. 17. The center of mass of each configuration is forced to be zero because we have set the k = 0 mode equal to zero. For this geometry, pinning quenches undulations.

Comparison of the free membrane and a larger membrane with square pinning. The pinning sites are located at every multiple of L = 112 nm in both the x and y directions as indicated by the red spheres and dots. The transparent green plane indicates h(r) = 0. (a) Membrane configuration drawn from Eq. 15 for a system periodic with ℒ = 3L. (b) The y = 0 edge of the configuration. (c) Magnified view of one corner of the configuration from the large system. Note that the center of mass of this single corral is above zero. (d) A free membrane which has the restriction that half of the membrane be above zero and the other half below zero.

The same comparison as in Fig. 5 except with triangular pinning relevant for the red blood cell membrane. The pinning sites are located at (1/2,0), (3/2,0), (1,0), (1,1), (1,2), (2,1/2), and (2,3/2) in units of L.
One realization of the membrane with L = ℒ = 112 nm including the k = 0 mode. The presence of this mode allows the center of mass to be nonzero, but still requires periodicity over L.

Analytical and simulation results for statistical quantities related to thermal membrane undulations discussed in the text. The upper plot shows the probability that the height is greater than h0 as a function of h0 for a free membrane with ℒ = L = 140 nm. The lower plot shows the number correlation function as a function of time for the same system, but with h0 = 6 nm (the size of band 3). Analytical results are based on Eqs. 23, 24, and 26 with physical parameters taken from Table 1. Simulation data based on Eqs. 15 and 16 is plotted for different sample sizes. At 105 samples, the data is indistinguishable from the analytical results on the scale of this figure. The value of ℒ = 140 nm is chosen for comparison with our previous results (Brown, 2003).

Statistical quantities that characterize protein mobility for L = 112 nm. Each column represents a particular geometry and system size (ℒ) shown in parenthesis. The upper plots show the probability that the height is greater than h0 as a function of h0. The lower plots show the number correlation function as a function of time using h0 = 6 nm. We plot at several values of x using constant y = 0 for the square geometry and y = L for the triangular geometry so that the x coordinate always moves along the edge of the corral (refer to Figs. 5 and 6 for the location of the pinning sites). For all plots, the case of the free membrane with ℒ = L is shown for reference. In the case of a pinned system with ℒ = L, the plot at the midpoint of the corral edge (x = 0.5L) is essentially indistinguishable from the plot for the free membrane. The same is not true for the larger systems, where P(r) and C(r, t) at x = 0.25L are already larger than the free membrane values. The square and triangular systems saturate at 4L so that the plots are the same as for ℒ = ∞.

Plot of the opening probability P(x)C(x, tD) as a function of x/L with L = 112 nm and h0 = 6 nm for different geometries and system sizes (ℒ) shown in parentheses. The systems used here are the same as those used in Fig. 9. We use constant y = 0 for the square geometry and y = L for the triangular geometry (refer to Figs. 5 and 6 for the location of the pinning sites). For reference, the value of the escape probability for the free membrane is 0.12 × 10⁻³. The larger systems have average probabilities that are more than an order of magnitude larger than the smaller systems. The geometry, however, makes little difference. Notice the slight drop near x = 0.5L for the case ℒ = L. The longest wavelength mode in this case goes through zero at the midpoint, causing a dip that is an artifact of periodicity over the length scale of the corral. In the larger systems, the dominant modes have longer wavelengths and this behavior is not observed.

Plot of the macroscopic diffusion constant Dmacro as a function of h0 for a square pinned membrane with L = 112 nm and ℒ = 4L. Global diffusivity shows a strong dependence on the extent of intracellular protrusion of the mobile protein.
References
-
- Arfken, G. B., and H. J. Weber. 2001. Mathematical Methods for Physicists, 5th Ed. Academic Press, San Diego, CA. 90, 93.
-
- Ashcroft, N. W., and N. D. Mermin. 1976. Solid State Physics. Holt, Rinehart and Winston, New York.
-
- Atkins, P. W. 1990. Physical Chemistry, 4th ed. W. H. Freeman and Co., New York.
-
- Ayton, G., S. G. Bardenhagen, P. McMurty, D. Sulsky, and G. A. Voth. 2001. Interfacing continuum and molecular dynamics: an application to lipid bilayers. J. Chem. Phys. 114:6913–6924.
Publication types
MeSH terms
Substances
LinkOut - more resources
Full Text Sources
