

Dielectric behavior of lysozyme and ferricytochrome-c in water/ethylene-glycol solutions
- PMID: 14747346
- PMCID: PMC1303904
- DOI: 10.1016/S0006-3495(04)74186-7
Dielectric behavior of lysozyme and ferricytochrome-c in water/ethylene-glycol solutions
Abstract
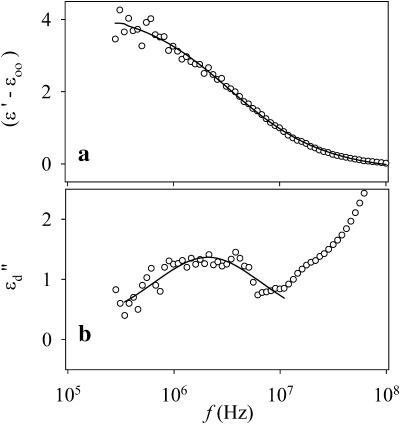
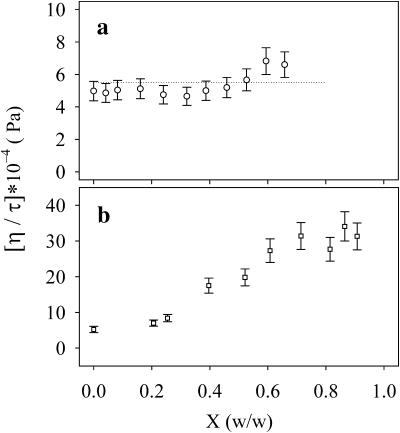
This work deals with a dielectric study at radio frequencies of the influence at room temperature of two organic molecules, known as cryo-protectants, ethylene-glycol and glycerol, on conformational and dynamic properties of two model proteins, lysozyme (lys) from chicken egg-white and ferricytochrome-c (cyt-c) from horse heart. Cyt-c is a compact globular protein whereas lys is composed of two structural domains, separated by the active site cleft. Measurements were carried out at the fixed temperature of 20 degrees C varying the concentration of the cosolvent up to 90% w/w. From the analysis of the dielectric relaxation of the protein solution, the effective hydrodynamic radius and the electric dipole moment of the protein were calculated as a function of the cosolvent concentration. The data show that glycerol does not modify significantly the conformation of both proteins and cyt-c is also stable in the presence of ethylene-glycol. On the contrary ethylene-glycol strongly affects the dielectric response of lysozyme denoting a specific effect on its conformation and dynamics. The data are coherently interpreted hypothesizing that glycol molecule wedges between and separates the two domains of lys making them rotationally independent.
Figures


References
-
- Arakawa, T., and S. N. Timasheff. 1985. Mechanism of poly(ethylene glycol) interaction with proteins. Biochemistry. 24:6756–6762. - PubMed
-
- Arakawa, T., J. F. Carpenter, Y. A. Kita, and J. H. Crowe. 1990. The basis for toxicity of certain cryoprotectants: an hypothesis. Cryobiology. 27:401–415.
-
- Athey, T. W., M. A. Stuckly, and S. S. Stuckly. 1982. Measurement of radio frequency permittivity of biological tissues with an open-ended coaxial line: part I. IEEE Trans. MTT. 30:82–86.
-
- Bonincontro, A., G. Briganti, A. Giansanti, F. Pedone, and G. Risuleo. 1996. Electrical conductivity and dielectric dispersion of E. coli 70S ribosomes and of 30S and 50S subunits: effects of magnesium ions. Colloids Surf. B. 6:219–226.
-
- Bonincontro, A., A. De Francesco, and G. Onori. 1998. Influence of pH on lysozyme conformation revealed by dielectric spectroscopy. Colloids Surf. B. 12:1–5.
Publication types
MeSH terms
Substances
LinkOut - more resources
Full Text Sources
