. 2004 Feb;86(2):1185-200.
doi: 10.1016/S0006-3495(04)74193-4.

Localization accuracy in single-molecule microscopy

Affiliations

Localization accuracy in single-molecule microscopy

Raimund J Ober et al. Biophys J. 2004 Feb.

Erratum in

  • Biophys J. 2004 Aug;87(2):1399

Abstract

One of the most basic questions in single-molecule microscopy concerns the accuracy with which the location of a single molecule can be determined. Using the Fisher information matrix it is shown that the limit of the localization accuracy for a single molecule is given by, lambda(em)/2pi n(a) square root of gammaAt, where lambda(em), n(a), gamma, A, and t denote the emission wavelength of the single molecule, the numerical aperture of the objective, the efficiency of the optical system, the emission rate of the single molecule and the acquisition time, respectively. Using Monte Carlo simulations it is shown that estimation algorithms can come close to attaining the limit given in the expression. Explicit quantitative results are also provided to show how the limit of the localization accuracy is reduced by factors such as pixelation of the detector and noise sources in the detection system. The results demonstrate what is achievable by single-molecule microscopy and provide guidelines for experimental design.


Figures

FIGURE 1
FIGURE 1
Schematic setup of the optical system used to capture the image of a single molecule. Here θ ≔ (u, v) denotes the position of the single molecule on the specimen plane and r0 = (x0, y0) = denotes the position of the center of the image of the single molecule on the detector plane where M denotes the magnification of the lens.
FIGURE 2
FIGURE 2
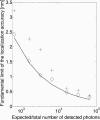
Fundamental limit (solid line) of the localization accuracy (see Eq. 2) for the u coordinate of a single molecule with experimental parameters similar to those for a GFP molecule as a function of the expected number of detected photons γAt = 66,000 photons/s t. The x axis range corresponds to an acquisition time range from t = 0.01 s to t = 1 s. The figure also shows the standard deviation of the maximum likelihood estimates of the single-molecule position as a function of the expected number γAt of detected photons (+) and as a function of the total number of detected photons (⋄). The standard deviations of both the estimates approach the fundamental limit as the expected (total) number of detected photons increases. Note that the standard deviation for the latter case is uniformly closer to the fundamental limit than for the former case.
FIGURE 3
FIGURE 3
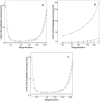
Limit of the localization accuracy for the u coordinate of a single molecule with experimental parameters similar to those for a GFP molecule for an 11 × 11 pixel array (5 μm × 5 μm pixel size) as a function of magnification for different acquisition times and noise levels. Panels a and c, respectively, show results in the noise-free case for t = 0.01 s (⋄) and t = 1 s (○). In both figures, the fundamental limit (solid line) is also shown for reference. Panel b shows results for two different sets of noise parameter values. Here, × corresponds to a scattering rate (bk) of 6600 photons/pixel/s and a readout noise (σk) of 57 e/pixel (rms), and • corresponds to a scattering rate of 660 photon/pixel/s and a readout noise of 7 e/pixel (rms). In both cases the acquisition time is 10 ms.
FIGURE 4
FIGURE 4
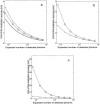
Limit of the localization accuracy of the u coordinate of a single molecule with experimental parameters similar to those for a GFP molecule as a function of the expected number of detected photons for a pixelated detector in the presence of different noise levels. Panel a shows the results in the noise-free case for a 5 × 5 pixel array (•) and for a 21 × 21 pixel array (triangles). The fundamental limit (solid line) is also shown for reference. Panel b shows the limit of the localization accuracy (○) in the presence of noise with a scattering rate (bk) of 660 photons/pixel/s and a readout noise (σk) of 7 e/pixel (rms) for a 5 × 5 pixel array. Similarly, panel c shows the limit of the localization accuracy (⋄) with a scattering rate (bk) of 6600 photons/pixel/s and a readout noise (σk) of 57 e/pixel (rms). For all the plots the pixel size is fixed to 6.8 μm × 6.8 μm and the x axis range corresponds to an acquisition time range from t = 0.01 s to t = 1 s. In panels b and c, the limit of the localization accuracy in the noise-free case (•) for a 5 × 5 pixel array is also shown for reference.
FIGURE 5
FIGURE 5
Limit of the localization accuracy of the u coordinate of a single molecule with experimental parameters similar to those for a GFP molecule as a function of pixel size for a pixelated detector in the presence of measurement noise. ⋄ corresponds to a readout noise (σk) of 57 e/pixel (rms), ○ corresponds to a readout noise (σk) of 7 e/pixel (rms), and the scattering rate (bk) is set to 0 in both the cases. The limit of the localization accuracy in the noise-free case (•) and the fundamental limit (solid line) are also shown for reference. For all the plots the acquisition time is set to be t = 0.05 s and the pixel array size is 1000 μm × 1000 μm. The pixel sizes were chosen such that the pixel array consists of an odd number of rows and columns.
FIGURE 6
FIGURE 6
Limit of the localization accuracy of the u coordinate of a single molecule with experimental parameters similar to those for a GFP molecule for a pixelated detector as a function of the single-molecule position for different noise levels and pixel sizes. Panel a (triangles) shows results in the presence of noise with a scattering rate (bk) of 6600 photons/pixel/s and a readout noise (σk) of 57 e/pixel (rms) for a 5 × 5 pixel array with a pixel size of 20 μm × 20 μm. Panel b shows the same for a scattering rate (bk) of 660 photons/pixel/s and a readout noise (σk) of 7 e/pixel (rms) (triangles). Panel c shows results in the noise-free case for a 10 × 10 pixel array with 10 μm × 10 μm pixels (⋄) and for a 50 × 50 pixel array with 2 μm × 2 μm pixels (○). The fundamental limit (solid line) is also shown for reference. In all three plots the acquisition time is t = 0.01 s, the pixel array size is 100 μm × 100 μm, and • shows the limit of the localization accuracy in the noise-free case for a 5 × 5 pixel array with 20-μm × 20-μm pixels. The x axis of the plots denotes the position of the single molecule with respect to the center of the pixel array (in the detector plane). The single molecule is moved in steps of 10 nm in the specimen plane, which corresponds to 1-μm steps in the detector plane. All movements are parallel to the pixel edges. For a 20 μm × 20 μm pixel this corresponds to moving the single molecule from one edge of the central pixel to the opposite edge of the pixel, whereas for a 10 μm × 10 μm pixel this corresponds to moving the single molecule over a pair of pixels that are centrally located on the detector and for a 5 μm × 5 μm pixel this corresponds to moving the single molecule over a set of four pixels centrally located on the detector.

References

    1. Betzig, E. 1995. Proposed method for molecular optical imaging. Opt. Lett. 20:237–239. - PubMed
    1. Bobroff, N. 1986. Position measurement with a resolution and noise limited instrument. Rev. Sci. Instrum. 57:1152–1157.
    1. Born, M., and E. Wolf. (1999). Principles of Optics. Cambridge University Press, Cambridge, UK.
    1. Chalfie, M., Y. Tu, G. Euskirchen, W. W. Ward, and D. C. Prasher. 1994. Green fluorescent protein as a marker for gene expression. Science. 263:802–805. - PubMed
    1. Cheezum, M. K., W. F. Walker, and W. H. Guilford. 2001. Quantitative comparision of algorithms for tracking single fluorescent particles. Biophys. J. 81:2378–2388. - PMC - PubMed

Publication types