

Comparative study of adaptive molecular evolution in different human immunodeficiency virus groups and subtypes
- PMID: 14747561
- PMCID: PMC369455
- DOI: 10.1128/jvi.78.4.1962-1970.2004
Comparative study of adaptive molecular evolution in different human immunodeficiency virus groups and subtypes
Erratum in
- J Virol. 2004 Apr;78(8):4381-2
Abstract
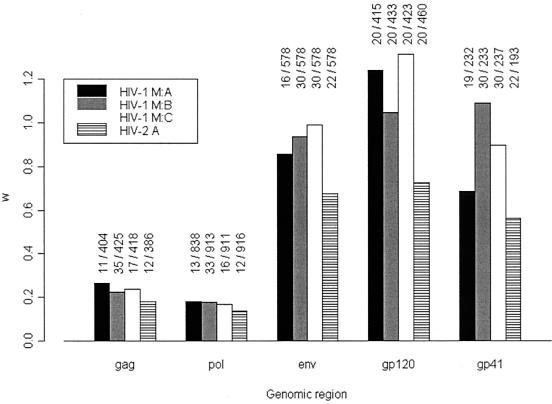
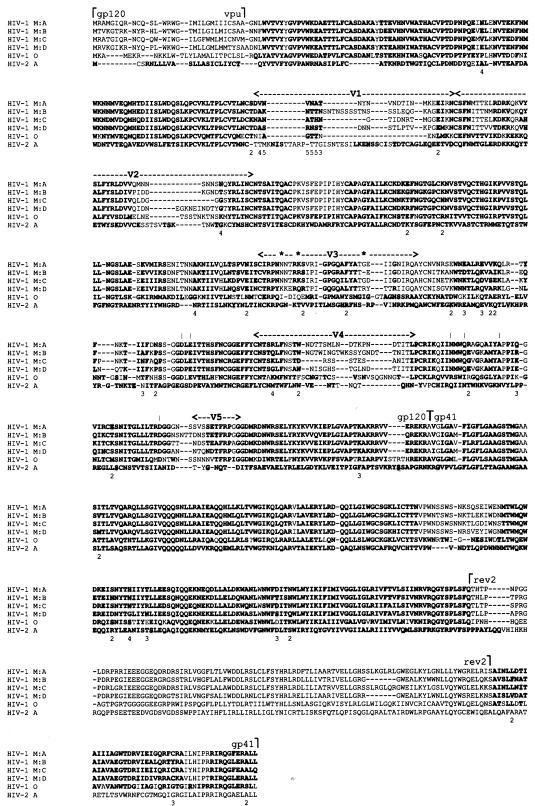
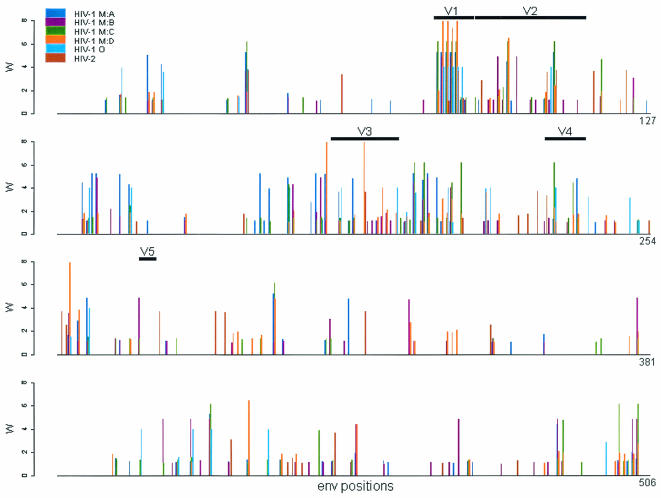
Molecular adaptation, as characterized by the detection of positive selection, was quantified in a number of genes from different human immunodeficiency virus type 1 (HIV-1) group M subtypes, group O, and an HIV-2 subtype using the codon-based maximum-likelihood method of Yang and coworkers (Z. H. Yang, R. Nielsen, N. Goldman, and A. M. K. Pedersen, Genetics 155:431-449, 2000). The env gene was investigated further since it exhibited the strongest signal for positive selection compared to those of the other two major HIV genes (gag and pol). In order to investigate the pattern of adaptive evolution across env, the location and strength of positive selection in different HIV-1 sequence alignments was compared. The number of sites having a significant probability of being positively selected varied among these different alignment data sets, ranging from 25 in HIV-1 group M subtype A to 40 in HIV-1 group O. Strikingly, there was a significant tendency for positively selected sites to be located at the same position in different HIV-1 alignments, ranging from 10 to 16 shared sites for the group M intersubtype comparisons and from 6 to 8 for the group O to M comparisons, suggesting that all HIV-1 variants are subject to similar selective forces. As the host immune response is believed to be the dominant driving force of adaptive evolution in HIV, this result would suggest that the same sites are contributing to viral persistence in diverse HIV infections. Thus, the positions of the positively selected sites were investigated in reference to the inferred locations of different epitope types (antibody, T helper, and cytotoxic T lymphocytes) and the positions of N and O glycosylation sites. We found a significant tendency for positively selected sites to fall outside T-helper epitopes and for positively selected sites to be strongly associated with N glycosylation sites.
Figures
References
-
- Anisimova, M., J. P. Bielawski, and Z. Yang. 2002. Accuracy and power of the Bayes prediction of amino acid sites under positive selection. Mol. Biol. Evol. 19:950-958. - PubMed
-
- Anisimova, M., J. P. Bielawski, and Z. Yang. 2001. Accuracy and power of the likelihood ratio test in detecting adaptive molecular evolution. Mol. Biol. Evol. 18:1585-1592. - PubMed
-
- Ayouba, A., S. Souquieres, B. Njinku, P. M. Martin, M. C. Muller-Trutwin, P. Roques, F. Barre-Sinoussi, P. Mauclere, F. Simon, and E. Nerrienet. 2000. HIV-1 group N among HIV-1-seropositive individuals in Cameroon. AIDS 14:2623-2625. - PubMed
-
- Bonhoeffer, S., E. C. Holmes, and M. A. Nowak. 1995. Causes of HIV diversity. Nature 376:125. - PubMed
-
- Botarelli, P., B. A. Houlden, N. L. Haigwood, C. Servis, D. Montagna, and S. Abrignani. 1991. N-glycosylation of HIV-gp120 may constrain recognition by T lymphocytes. J. Immunol. 147:3128-3132. - PubMed
Publication types
MeSH terms
Substances
Grants and funding
LinkOut - more resources
Full Text Sources
Research Materials
