. 2004 Feb 10;101(6):1584-8.
doi: 10.1073/pnas.0308205100. Epub 2004 Jan 27.

Centrosome maturation: measurement of microtubule nucleation throughout the cell cycle by using GFP-tagged EB1

Affiliations

Centrosome maturation: measurement of microtubule nucleation throughout the cell cycle by using GFP-tagged EB1

Michelle Piehl et al. Proc Natl Acad Sci U S A. .

Abstract

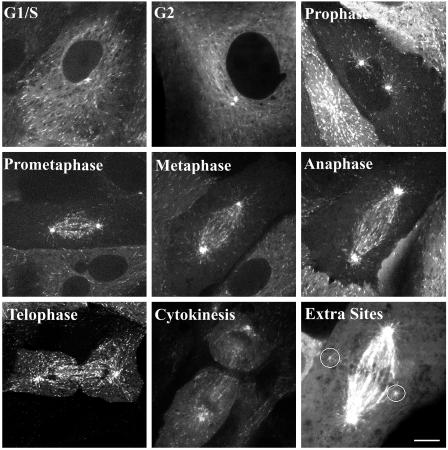
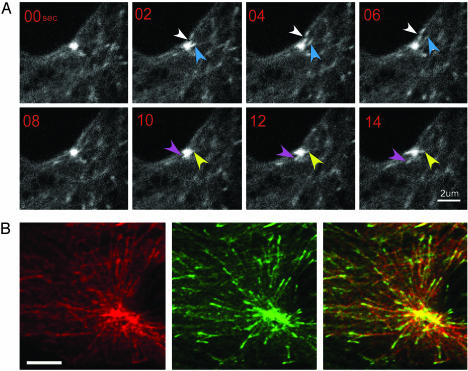
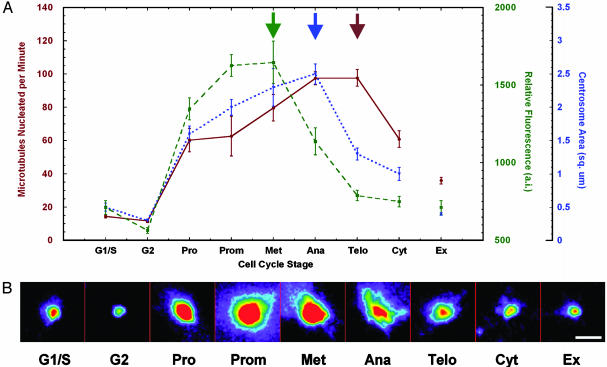
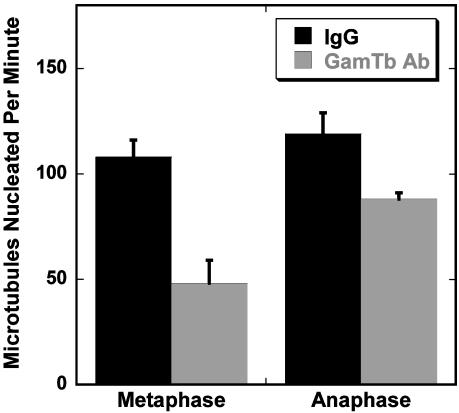
Understanding how cells regulate microtubule nucleation during the cell cycle has been limited by the inability to directly observe nucleation from the centrosome. To view nucleation in living cells, we imaged GFP-tagged EB1, a microtubule tip-binding protein, and determined rates of nucleation by counting the number of EB1-GFP comets emerging from the centrosome over time. Nucleation rate increased 4-fold between G(2) and prophase and continued to rise through anaphase and telophase, reaching a maximum of 7 times interphase rates. We tested several models for centrosome maturation, including gamma-tubulin recruitment and increased centrosome size. The centrosomal concentration of gamma-tubulin reached a maximum at metaphase, and centrosome size increased through anaphase, whereas nucleation remained high through telophase, implying the presence of additional regulatory processes. Injection of anti-gamma-tubulin antibodies significantly blocked nucleation during metaphase but was less effective during anaphase, suggesting that a nucleation mechanism independent of gamma-tubulin contributes to centrosome function after metaphase.


Figures

Fig. 2.
Fig. 2.
Representative images of EB1-GFP during different stages of the cell cycle. Digital image series from each cell cycle stage were used to count nucleation events per minute. For the telophase cell, only the left centrosome is in focus. In a subset of cells, extra nucleation sites were present (marked by circles). The image labeled Extra Sites was adjusted to show these dim extra nucleation sites. Digital movies of MT nucleation during G1/S and metaphase are available as Movies 1 and 2. (Scale bar, 10 μm.)
Fig. 1.
Fig. 1.
EB1-GFP labels new MT ends as they emerge from the centrosome. (A) Time series of EB1-GFP comets emerging from a G1 centrosome. Each colored arrow follows a single EB1-GFP comet. Typically, each comet was visible for three to four frames. Images were collected by spinning disk confocal microscopy. (B) An interphase LLCPK cell stably expressing EB1-GFP was injected with rhodamine-tubulin and fixed <5 min later. Shown is a single LSM optical section. Both rhodamine tubulin and EB1-GFP brightly label each of the two closely spaced centrosomes in this cell. (Scale bar, 5 μm.)
Fig. 3.
Fig. 3.
Rates of MT nucleation throughout the cell cycle do not correlate with changes in γ-tubulin recruitment to the centrosome or centrosome size. (A) Entry into mitosis corresponds with a 4-fold increase in nucleation rate. This rate continues to rise and reaches a maximum at anaphase and telophase. Rates were determined from image sequences acquired from 4–12 cells per cell cycle stage. γ-Tubulin staining intensity at the centrosome rose dramatically at prophase and peaked at metaphase. Centrosome area increased from prophase to anaphase. The area of the centrosome was determined by tracing the outline of γ-tubulin staining intensity. For both γ-tubulin staining intensity and centrosome area, 20–38 centrosomes were measured for each time point. Ex refers to extra nucleation sites present in a subset of cells. Data for extra sites were from metaphase cells. Data shown are mean ± SE. Arrows note maximum. (B) Representative images of γ-tubulin-stained centrosomes. Images were spectrally coded to represent staining intensity (red is the highest intensity). No saturated pixels were present in the original grayscale 12-bit images. (Scale bar, 3 μm.)
Fig. 4.
Fig. 4.
Microinjection of an antibody to γ-tubulin blocks nucleation during metaphase but is less effective during anaphase. Cells were microinjected with a function-blocking γ-tubulin antibody coupled to Cy3 or with Cy3-rabbit IgG and then imaged by LSM. Injection of 0.5 mg/ml antibody (needle concentration) into metaphase cells resulted in a large decrease in nucleation rate. Anaphase cells injected with anti γ-tubulin showed a much smaller decrease in nucleation rate. Data shown are mean ± SE for 8–18 centrosomes for each condition. Injection alone did not change the nucleation rate. Mean nucleation rates for noninjected and control IgG-injected metaphase and anaphase cells were not significantly different (P < 0.05).

References

    1. Bornens, M. (2002) Curr. Opin. Cell Biol. 14, 25-34. - PubMed
    1. Dictenberg, J. B., Zimmerman, W., Sparks, C. A., Young, A., Vidair, C., Zheng, Y., Carrington, W., Fay, F. S. & Doxsey, S. J. (1998) J. Cell Biol. 141, 163-174. - PMC - PubMed
    1. Andersen, S. S. L. (1999) Int. Rev. Cytol. 187, 51-109. - PubMed
    1. Palazzo, R. E., Vogel, J. M., Schnackenberg, B. J., Hull, D. R. & Wu, X. (2000) Curr. Top. Dev. Biol. 49, 449-470. - PubMed
    1. Kuriyama, R. & Borisy, G. G. (1981) J. Cell Biol. 91, 822-826. - PMC - PubMed

Publication types

Substances

LinkOut - more resources