

doi: 10.1186/1476-072X-3-2.
Descriptive review of geographic mapping of severe acute respiratory syndrome (SARS) on the Internet
Affiliations
- PMID: 14748926
- PMCID: PMC343293
- DOI: 10.1186/1476-072X-3-2
Item in Clipboard
Descriptive review of geographic mapping of severe acute respiratory syndrome (SARS) on the Internet
Int J Health Geogr.
.
Abstract
From geographic mapping at different scales to location-based alerting services, geoinformatics plays an important role in the study and control of global outbreaks like severe acute respiratory syndrome (SARS). This paper reviews several geographic mapping efforts of SARS on the Internet that employ a variety of techniques like choropleth rendering, graduated circles, graduated pie charts, buffering, overlay analysis and animation. The aim of these mapping services is to educate the public (especially travellers to potentially at-risk areas) and assist public health authorities in analysing the spatial and temporal trends and patterns of SARS and in assessing/revising current control measures.
Figures
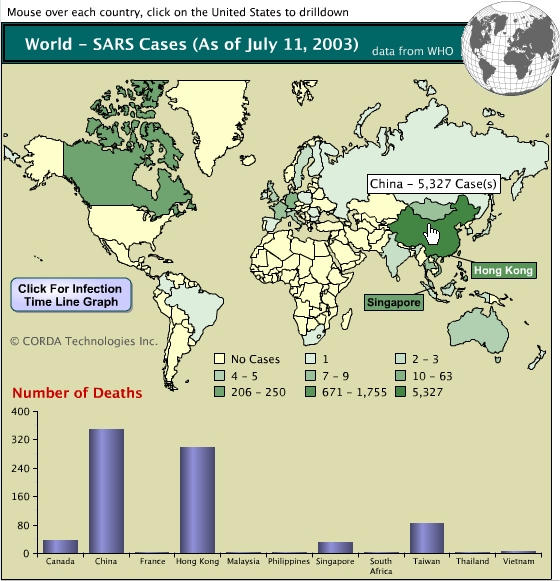
Corda's world map of SARS. Web browser screenshot by this author of Corda's world map of SARS displaying data for each country affected by SARS as of 11 July 2003
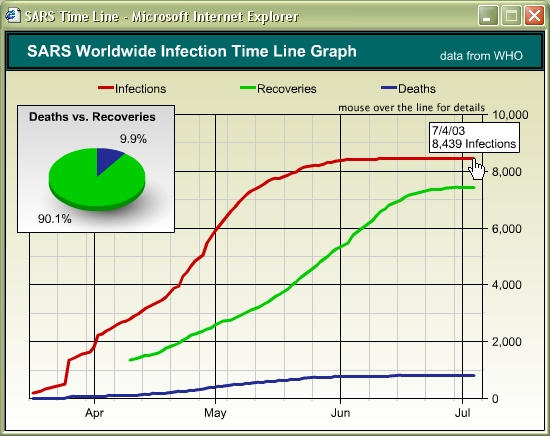
Corda's SARS worldwide infections/recoveries/deaths time line graph. Web browser screenshot by this author of Corda's SARS worldwide infections/recoveries/deaths time line graph as of 4 July 2003
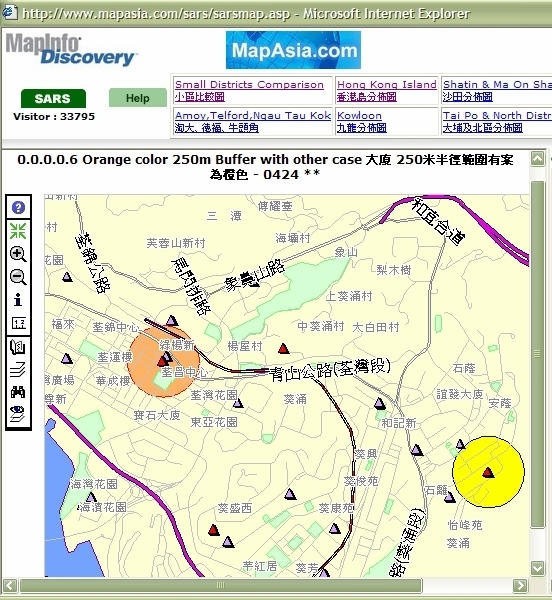
One of MapAsia's SARS distribution maps for Hong Kong. Web browser screenshot by this author of one of MapAsia's SARS distribution maps for Hong Kong as of 24 April 2003. Legend: orange circle buffer: some other case(s) within 250 m; yellow circle buffer: no other case within 250 m; red triangle: infected case; purple triangle: de-listed case. The toolbar to the left of the map provided the sort of functionality found in a standard desktop GIS interface.
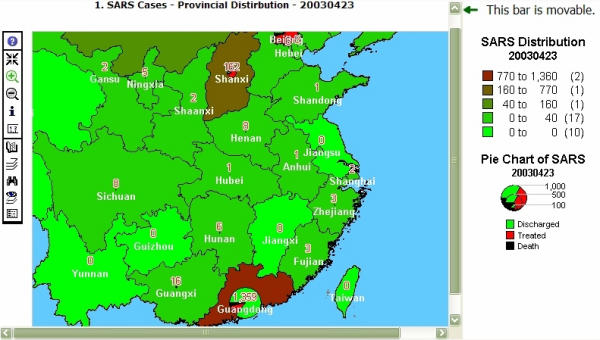
One of MapAsia's provincial SARS distribution maps of China. Web browser screenshot of one of MapAsia's provincial SARS distribution maps of China as of 23 April 2003. Note the choropleth rendition and graduated pie charts, e.g., the small pie chart over Shanxi (162 cases) and the large one over Guangdong (1359 cases), each with colour-coded slices representing the relative numbers of discharged/under treatment/dead cases in the corresponding province.
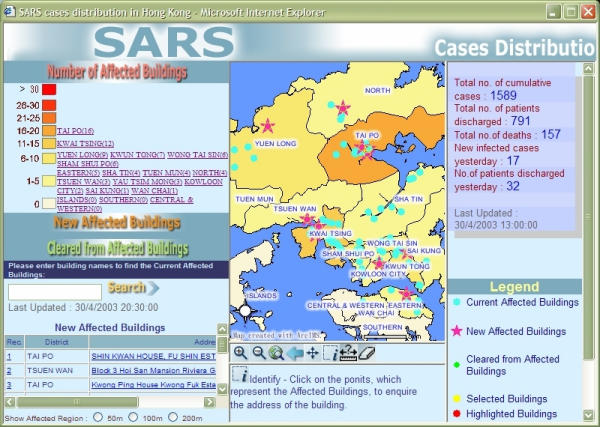
ESRI China's "SARS GIS" – SARS case distribution in Hong Kong. Web browser screenshot by this author of ESRI China's "SARS GIS" – SARS case distribution in Hong Kong as of 30 April 2003
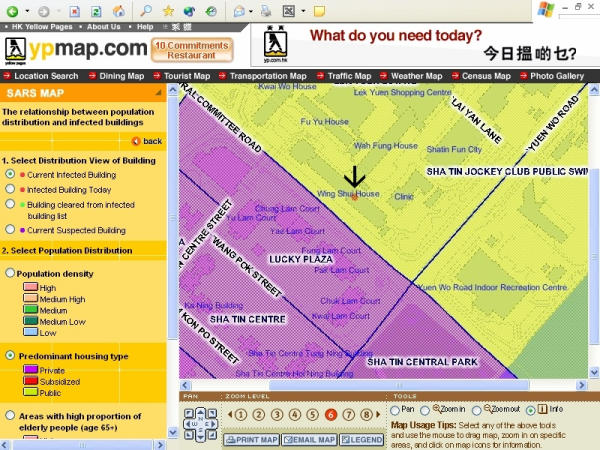
One of Hong Kong SARS distribution maps by Hong Kong Yellow Pages. Web browser screenshot by this author of one of Hong Kong SARS distribution maps by Hong Kong Yellow Pages as of 25 May 2003
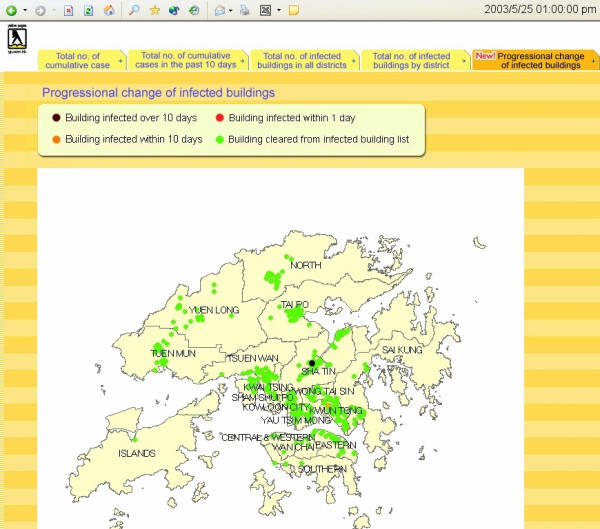
Hong Kong Yellow Pages map showing the progressional change of SARS-infected buildings in Hong Kong. Web browser screenshot by this author of a map by Hong Kong Yellow Pages showing the progressional change of SARS-infected buildings in Hong Kong as of 25 May 2003
References
-
- World Health Organisation – Communicable Disease Surveillance & Response (CSR) Severe Acute Respiratory Syndrome (SARS) http://www.who.int/csr/sars/en/
-
- Zambon M. Severe acute respiratory syndrome revisited. Br Med J. 2003;326:831–2. doi: 10.1136/bmj.326.7394.831. http://bmj.com/cgi/content/full/326/7394/831 - DOI - PMC - PubMed
-
- Chan-Yeung M, Yu WC. Outbreak of severe acute respiratory syndrome in Hong Kong Special Administrative Region: case report. Br Med J. 2003;326:850–2. doi: 10.1136/bmj.326.7394.850. http://bmj.com/cgi/content/full/326/7394/850 - DOI - PMC - PubMed
-
- Spurgeon D. Canada reports more than 300 suspected cases of SARS. Br Med J. 2003;326:897. doi: 10.1136/bmj.326.7395.897/a. http://bmj.com/cgi/content/full/326/7395/897/a - DOI - PMC - PubMed
-
- Ksiazek TG, Erdman D, Goldsmith CS, Zaki SR, Peret T, Emery S, Tong S, Urbani C, Comer JA, Lim W, Rollin PE, Dowell SF, Ling AE, Humphrey CD, Shieh WJ, Guarner J, Paddock CD, Rota P, Fields B, DeRisi J, Yang JY, Cox N, Hughes JM, LeDuc JW, Bellini WJ, Anderson LJ. A Novel Coronavirus Associated with Severe Acute Respiratory Syndrome. N Engl J Med. 2003;348:1953–1966. doi: 10.1056/NEJMoa030781. http://content.nejm.org/cgi/pmidlookup?view=reprint&pmid=12690092 - DOI - PubMed
LinkOut - more resources
Full Text Sources
Miscellaneous
