. 2004 Jan 28;3(1):1.
doi: 10.1186/1476-072X-3-1.

Towards evidence-based, GIS-driven national spatial health information infrastructure and surveillance services in the United Kingdom

Affiliations

Towards evidence-based, GIS-driven national spatial health information infrastructure and surveillance services in the United Kingdom

Maged N Kamel Boulos. Int J Health Geogr. .

Abstract

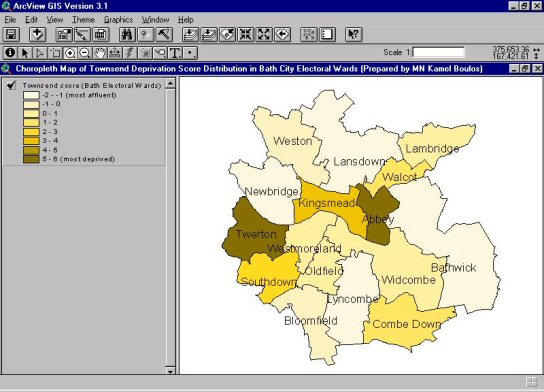
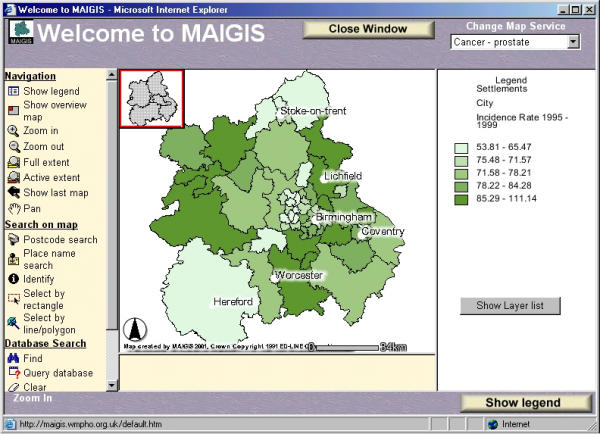
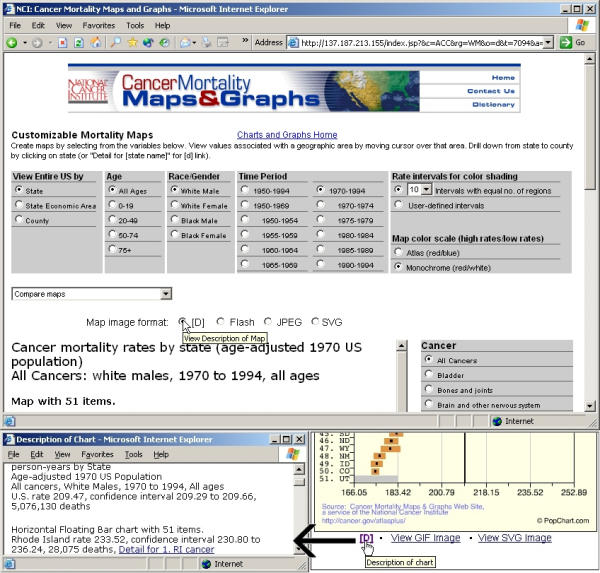
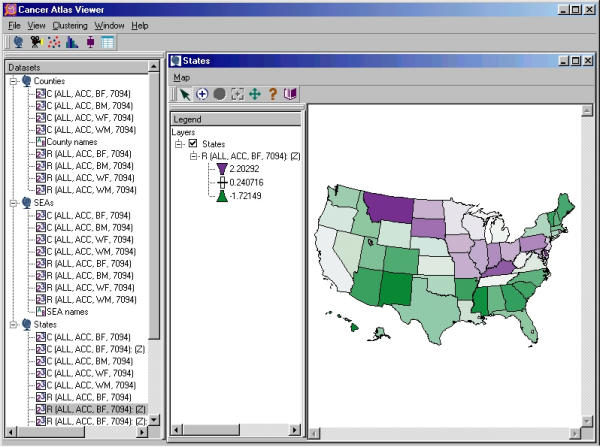
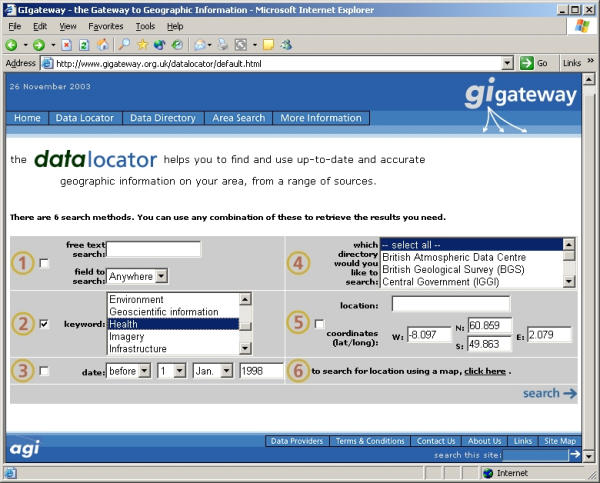
The term "Geographic Information Systems" (GIS) has been added to MeSH in 2003, a step reflecting the importance and growing use of GIS in health and healthcare research and practices. GIS have much more to offer than the obvious digital cartography (map) functions. From a community health perspective, GIS could potentially act as powerful evidence-based practice tools for early problem detection and solving. When properly used, GIS can: inform and educate (professionals and the public); empower decision-making at all levels; help in planning and tweaking clinically and cost-effective actions, in predicting outcomes before making any financial commitments and ascribing priorities in a climate of finite resources; change practices; and continually monitor and analyse changes, as well as sentinel events. Yet despite all these potentials for GIS, they remain under-utilised in the UK National Health Service (NHS). This paper has the following objectives: (1) to illustrate with practical, real-world scenarios and examples from the literature the different GIS methods and uses to improve community health and healthcare practices, e.g., for improving hospital bed availability, in community health and bioterrorism surveillance services, and in the latest SARS outbreak; (2) to discuss challenges and problems currently hindering the wide-scale adoption of GIS across the NHS; and (3) to identify the most important requirements and ingredients for addressing these challenges, and realising GIS potential within the NHS, guided by related initiatives worldwide. The ultimate goal is to illuminate the road towards implementing a comprehensive national, multi-agency spatio-temporal health information infrastructure functioning proactively in real time. The concepts and principles presented in this paper can be also applied in other countries, and on regional (e.g., European Union) and global levels.


Figures

Figure 1
Figure 1
A simple choropleth map of Townsend Deprivation Score distribution in Bath City Electoral Wards A simple choropleth (graduated colour) map of Townsend Deprivation Score distribution in Bath City Electoral Wards (UK). Abbey and Twerton are the most deprived wards (highest scores/darkest shade). (Prepared using ESRI ArcView GIS Version 3.1 and data from EDINA UKBORDERS and Census Dissemination Unit (CDU)/MIMAS.
Figure 2
Figure 2
Screenshot of MAIGIS Screenshot of MAIGIS (Multi-Agency Internet Geographic Information Service – ) showing an interactive map of the incidence rates by PCG (Primary Care Group) of prostate cancer in the West Midlands Region over the five year aggregated period 1995–1999. Rates have been directly standardised for age using the European Standard Population and are expressed as a rate per 100,000 population. To show the variation across the West Midlands region, rates have been divided into quintiles and shaded accordingly. Incidence data are provided by the West Midlands Cancer Intelligence Unit – .
Figure 3
Figure 3
Screenshot of ArcCatalog, part of ArcGIS Desktop 8.3 from ESRI Screenshot of ArcCatalog and the built-in ISO Metadata Wizard/editor (part of ArcGIS Desktop 8.3 from ESRI). ArcCatalog enables users to view their GIS data holdings, and create, manage, and edit associated metadata. ArcCatalog supports FGDC and ISO 19115 metadata standards using XML. With ArcIMS Metadata Services, users can create a central, online metadata repository for publishing and browsing metadata over the Internet.
Figure 4
Figure 4
GML map making Diagram showing the main steps involved in GML (Geography Markup Language) map making. GML contains map "content" only (e.g., where features are, their geometry, type and attributes), but does not provide any information about how that map data should be displayed. This allows different "stylesheets" to be applied to the geographic data to make it appear however the user wishes. By combining a selected map stylesheet with a Web Feature Service (WFS) query, users are presented with a fully interactive and editable vector map that can be viewed in any Web browser. (Adapted from [70].)
Figure 5
Figure 5
Screenshot of Section 508-compliant NCI cancer mortality maps and graphs Screenshot of the customisable cancer mortality maps and graphs developed by the US National Cancer Institute (NCI – ). These maps (upper part of screenshot) and the associated charts and graphs (lower part of screenshot) are compliant with Section 508 of the US Rehabilitation Act. This means they can be accessed by the blind or visually impaired through screen readers that read the text description file ([D] link) accompanying each map, graph or chart.
Figure 6
Figure 6
Screenshot of TerraSeer's Cancer Atlas Viewer Screenshot of TerraSeer's Cancer Atlas Viewer showing a US states diverging gradient map of Z-score standardised version of "R(ALL, ACC, BF, 7094)" numeric dataset, where R = the mortality rate per 100,000 person-years, age-adjusted to the 1970 US population, ALL = all ages combined, ACC = all cancers, BF = black female, and 7094 = the time period 1970–1994. TerraSeer's Cancer Atlas Viewer allows users to visualise and interact with space-time data from the National Cancer Mortality Atlas . Users can view the data in the form of maps, animated (slideshow) maps, tables, scatterplots, boxplots, and/or histograms, and can also use the software to perform statistics to evaluate spatial pattern in the data.
Figure 7
Figure 7
Screenshot of GIgateway Data Locator search form Screenshot of GIgateway Data Locator search form . GIgateway Data Locator is intended to help users find and use up-to-date and accurate geographic information on their area, from a range of sources. It features six search methods that can be used any combination to retrieve the results needed. One of these methods (6 – not shown) allows users to visually select a location using an interactive map of the UK.

References

    1. Gore A. The Digital Earth: Understanding our Planet in the 21st Century. Speech given at the California Science Centre: 31 January 1998; Los Angeles, California. http://www.digitalearth.gov/VP19980131.html
    1. Davenhall B. Building a Community Health Surveillance System. ArcUser Online. 2002. http://www.esri.com/news/arcuser/0102/comhealth1of2.html
    1. Higgs G, Richards W. The use of geographical information systems in examining variations in sociodemographic profiles of dental practice catchments: a case study of a Swansea practice. Prim Dent Care. 2002;9:63–9. doi: 10.1308/135576102322527829. - DOI - PubMed
    1. Waters E, Doyle J. Evidence-based public health: Cochrane update. J Public Health Med. 2003;25:72–5. doi: 10.1093/pubmed/fdg015. - DOI - PubMed
    1. US Federal Geographic Data Committee Homeland Security and Geographic Information Systems – How GIS and mapping technology can save lives and protect property in post-September 11th America. Public Health GIS News and Information. 2003;52:20–23.

LinkOut - more resources