. 2004 Feb;24(4):1516-30.
doi: 10.1128/MCB.24.4.1516-1530.2004.

Activation of H-Ras in the endoplasmic reticulum by the RasGRF family guanine nucleotide exchange factors

Affiliations

Activation of H-Ras in the endoplasmic reticulum by the RasGRF family guanine nucleotide exchange factors

Imanol Arozarena et al. Mol Cell Biol. 2004 Feb.

Abstract

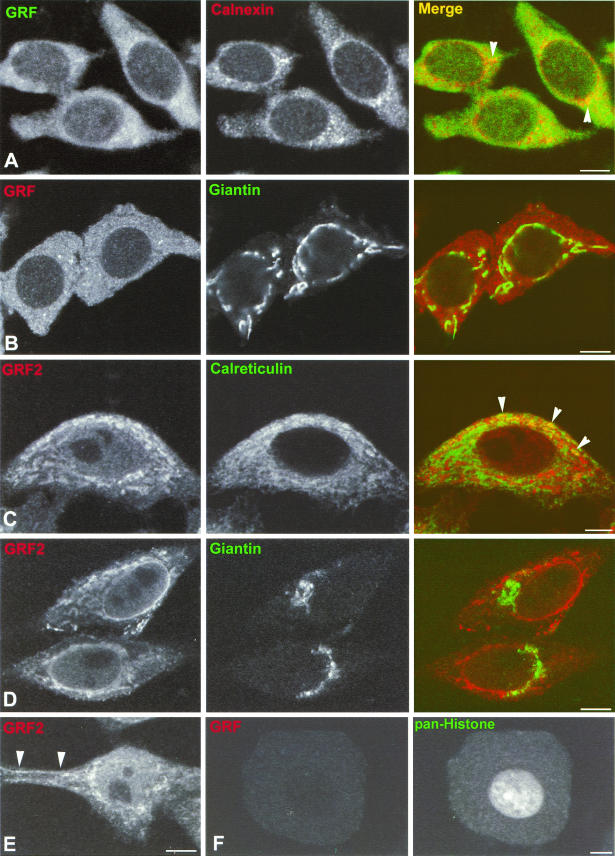
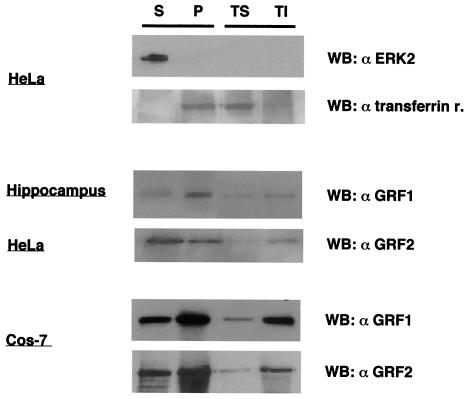
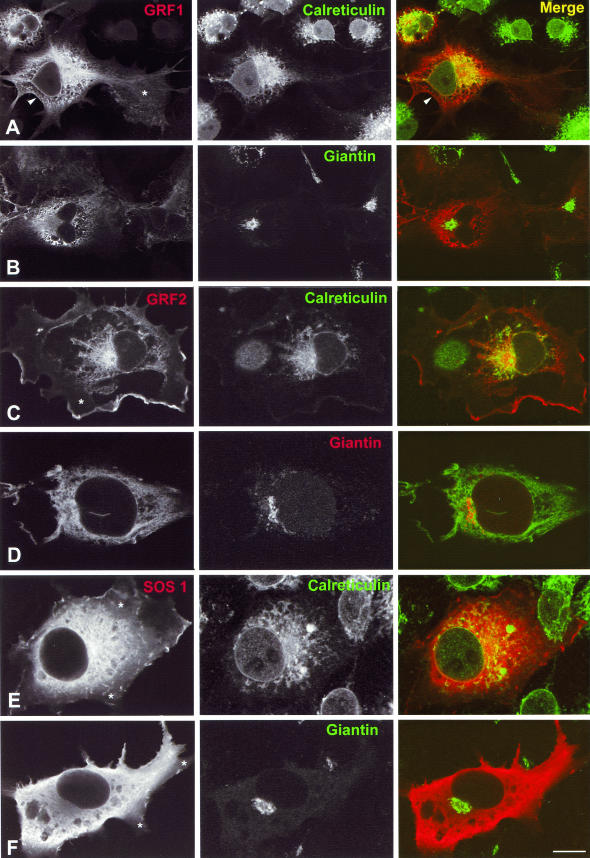
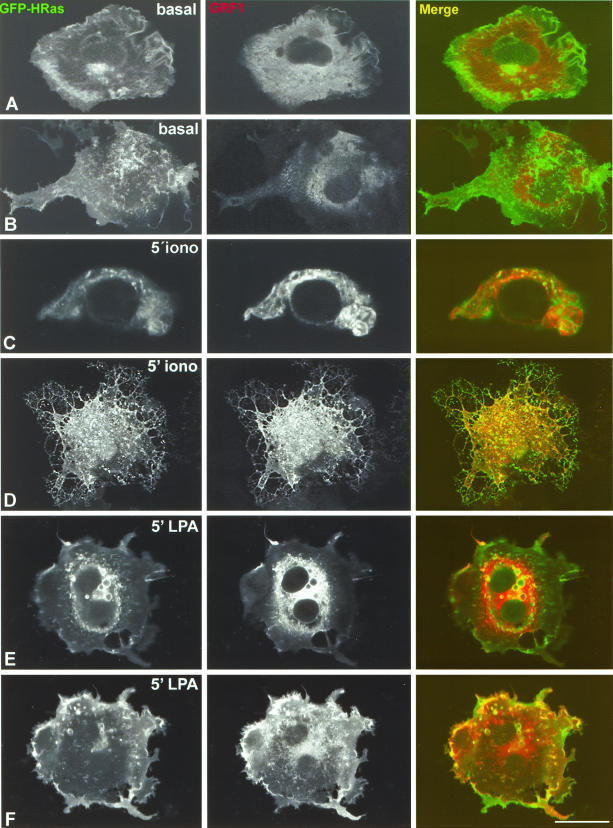
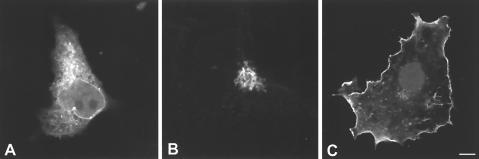
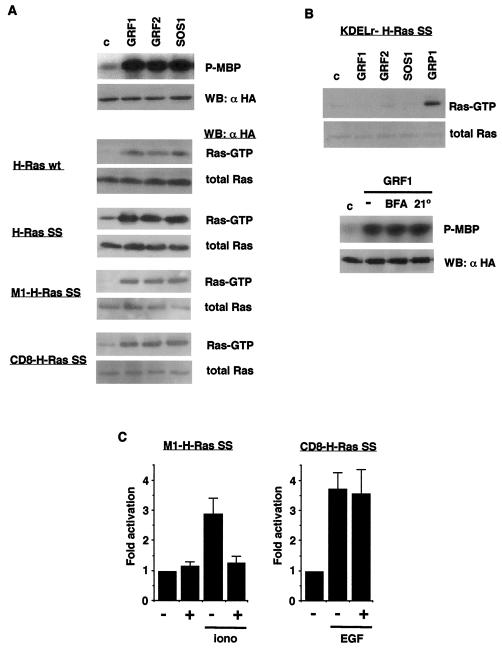
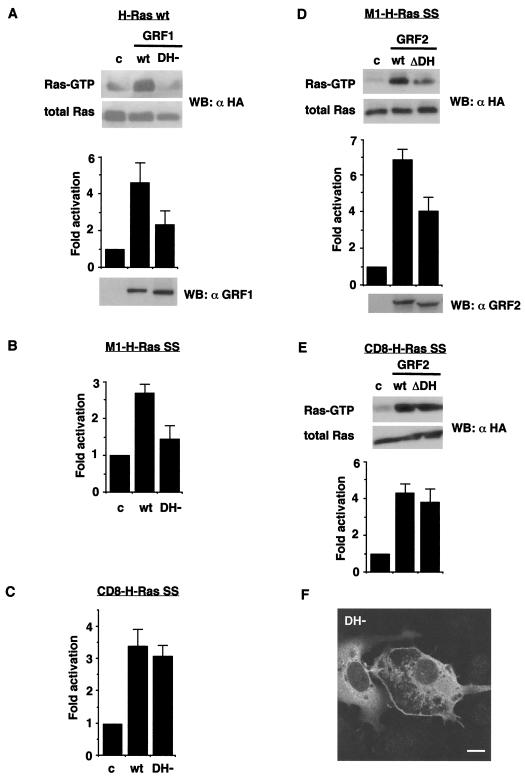
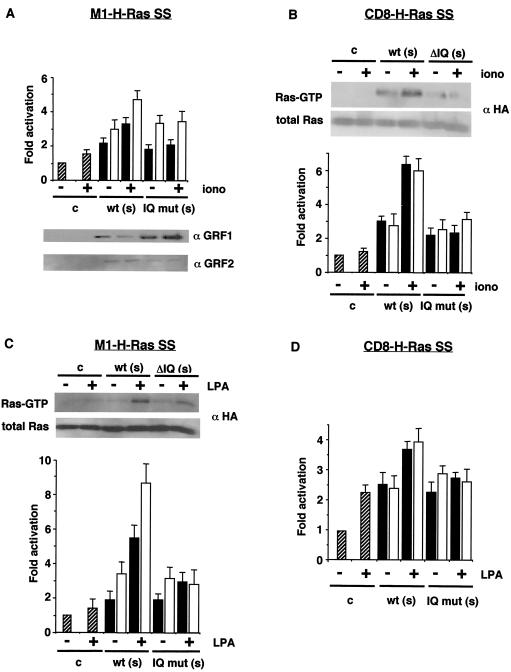
Recent findings indicate that in addition to its location in the peripheral plasma membrane, H-Ras is found in endomembranes like the endoplasmic reticulum and the Golgi complex. In these locations H-Ras is functional and can efficiently engage downstream effectors, but little is known about how its activation is regulated in these environments. Here we show that the RasGRF family exchange factors, both endogenous and ectopically expressed, are present in the endoplasmic reticulum but not in the Golgi complex. With the aid of H-Ras constructs specifically tethered to the plasma membrane, endoplasmic reticulum, and Golgi complex, we demonstrate that RasGRF1 and RasGRF2 can activate plasma membrane and reticular, but not Golgi-associated, H-Ras. We also show that RasGRF DH domain is required for the activation of H-Ras in the endoplasmic reticulum but not in the plasma membrane. Furthermore, we demonstrate that RasGRF mediation favors the activation of reticular H-Ras by lysophosphatidic acid treatment whereas plasma membrane H-Ras is made more responsive to stimulation by ionomycin. Overall, our results provide the initial insights into the regulation of H-Ras activation in the endoplasmic reticulum.


Figures

FIG.1.
FIG.1.
Subcellular localization of endogenous RasGRFs. (A and B) Localization of RasGRF in hippocampal neurons. Shown are confocalmicrographs representative of hippocampal pyramidal neurons doubly immunostained with anti-panRasGRF and anticalnexin (red) (A) or giantin (green) (B). Intense colocalization in punctate structures around the nucleus is indicated by arrow heads. (C to E) Localization of RasGRF2 in HeLa cells immunostained with anti-RasGRF2 (red) and anti-calreticulin (green) (C) or giantin (green) (D). Localization of RasGRF2 in regions of the PM is indicated by arrow heads in panel E. Calreticulin costaining demonstrated colocalization with RasGRF2 in the ER, as indicated by arrowheads in panel C. (F) Confocal micrographs of dorsal root ganglion neurons doubly immunostained with anti-panRasGRF (left panel) and with anti-pan-histone (right panel). All panels show equatorial sections at the cell nucleus level, except for panel E, which is more tangential. Bars, 10 μm (5 μm for panels C and F).
FIG. 2.
FIG. 2.
Analysis of RasGRF1 and RasGRF2 distribution by cellular fractionation in hippocampal neurons, HeLa cells, and RasGRF1- and RasGRF2-transfected (1 μg) COS-7 cells, revealed by immunoblotting with the indicated antibodies. ERK2 and transferrin receptor immunoblots served as controls for the soluble and particulate fractions, respectively. Lysates were fractionated as described in Materials and Methods. Lanes S, S100 soluble fraction; P, P100 particulate fraction. The particulate fraction was subsequently fractionated into Triton-soluble (TS) and Triton-insoluble (TI) fractions. WB, Western blot.
FIG.3.
FIG.3.
Subcellular localization of ectopic GEFs in COS-7 cells. Shown are confocal laser micrographs of COS-7 cells transfected with HA-RasGRF1 (A and B), Flag-RasGRF2 (C and D), or HA-SOS1 (E and F) (1 μg in each case). Cells expressing these different constructs were costained with antibodies directed against calreticulin (A, C, and E) or giantin (B, D, and F). RasGRF1 was revealed by anti-HA antibodies in panel A and by anti-RasGRF1 in panel B. RasGRF2 was revealed by anti-RasGRF2 antibodies in panel C and by anti-FLAG in panel D. SOS1 was revealed by anti-HA antibodies in panel E and by anti-SOS1 in panel F. Arrowheads in panel A indicate RasGRF1 at the PM. Asterisks in panels A, C, E, and F indicate an absence of GEFs from cytoplasmic extensions such as lamellipodia. Bars, 10 μm.
FIG. 4.
FIG. 4.
Colocalization of RasGRF1 and H-Ras under stimulation. COS-7 cells were cotransfected with suboptimal concentrations of RasGRF1 (0.1 μg) and with GFP-H-Ras (0.25 μg) and analyzed using confocal microscopy. (A and B) Basal conditions. An equatorial confocal section at the level of the cell nucleus (A) and a tangential section illustrating the PM (B) are shown. (C and D) Treatment with 1 μM ionomycin for 5 min. A confocal section at the cell nucleus level (C) and a confocal section sweeping through the cell surface (D) are shown. (E and F) Treatment with 10 μM LPA for 5 min. A confocal section at the cell nucleus level (E) and a confocal section illustrating the cell surface (F) are shown. Bars, 10 μm (5 μm for panel C).
FIG. 5.
FIG. 5.
Cellular localization of location-specific H-Ras constructs. COS-7 cells were transfected with the indicated constructs (0.25 μg in each case). (A) M1-H-Ras SS. (B) KDELr-H-Ras SS. (C) CD8-H-Ras SS. Immunofluorescence was performed using anti-HA antibodies. Bars, 10 μm.
FIG. 6.
FIG. 6.
Activation of H-Ras by GEFs in distinct membrane systems. (A) (Top) Activation of ERK2 by RasGRFs and SOS1. COS-7 cells were cotransfected with HA-ERK2 and the indicated GEFs (1 μg each). Kinase assays were performed in anti-HA immunoprecipitates, using MBP as substrate. (Middle) Levels of HA-ERK2 as determined by immunoblotting using anti-HA antibodies. (Bottom) Activation of H-Ras constructs tethered to defined locations. Ras GTP loading was determined, as described in Materials and Methods, in COS-7 cells transfected with the different GEFs (1 μg) in addition to the site-specific H-Ras constructs (0.25 μg), as indicated. H-Ras-GTP levels present in affinity precipitates using glutathione S-transferase (GST)-Raf RBD as bait and the total H-Ras levels in the corresponding total lysates were detected by anti-HA immunoblotting. WB, Western blotting; wt, wild type. (B) Activation of H-Ras in the Golgi complex. (Top) Ras GTP loading was determined, as described in Materials and Methods, with COS-7 cells transfected with the different GEFs (1 μg) as indicated, in addition to the Golgi-tethered KDELr-H-Ras SS construct (0.25 μg). (Bottom) Activation of ERK2 by RasGRF1 after treatments that affect the Golgi complex. COS-7 cells were cotransfected with HA-ERK2 and RasGRF1 (1 μg each), treated with 5 μg of BFA/ml for 30 min, or subjected to 21°C for 2 h. Kinase assays were performed with anti-HA immunoprecipitates, using MBP as the substrate. (Lower panel). Protein levels of HA-ERK2 as determined by immunoblotting using anti-HA antibodies. (C). Activation of reticular H-Ras by endogenous RasGRF. HeLa cells were transfected with M1-H-Ras SS or with CD8-H-Ras SS constructs (0.25 μg) as indicated, in addition to empty vector (−) or RasGRF1 ΔCdc25 (0.5 μg) (+), and stimulated with 1 μM ionomycin or with 100 ng of EGF/ml for 5 min where indicated. Ras-GTP loading was determined as previously described. Data show the mean of at least three independent experiments relative to the Ras-GTP levels detected in control cells. Error bars indicate standard error of the mean (SEM).
FIG. 7.
FIG. 7.
Role of RasGRF1 DH domain on the activation of H-Ras in distinct cellular locations. (A) Activation of total H-Ras by RasGRF1 DH−. H-Ras wild-type (wt) (0.25 μg) was transfected in COS-7 cells in addition to RasGRF1 wild type and the DH− mutant (1 μg) as indicated. (Upper panel) H-Ras-GTP levels from a representative experiment; Ras-GTP loading was determined as described in Materials and Methods. Data show means and SEM of at least five independent experiments relative to the Ras-GTP levels detected in control cells. (Lower panel) RasGRF1 expression levels as determined by immunoblotting using anti-RasGRF1 antibodies. (B) Activation of ER-bound M1-H-Ras by RasGRF1 DH−. Data show means and SEM of at least five independent experiments. (C) Activation of PM-tethered CD8-H-Ras by RasGRF1 DH−. Data show means and SEM of at least five independent experiments. (D) Activation of ER-tethered M1-H-Ras by RasGRF2 ΔDH. M1-H-Ras SS (0.25 μg) was transfected in COS-7 cells in addition to wild-type RasGRF2 and the ΔDH mutant (1 μg) as indicated. (Upper panel) H-Ras-GTP levels from a representative experiment. Data show means and SEM of at least five independent experiments relative to the Ras-GTP levels detected in control cells. (Lower panel) RasGRF2 expression levels as determined by immunoblotting using anti-RasGRF2 antibodies. (E) Activation of membrane-tethered CD8-H-Ras by RasGRF2 ΔDH. Data show means and SEM of at least five independent experiments. (F) Cellular localization of RasGRF1 DH− (1 μg) transfected in COS-7 cells. Bar, 10 μm.
FIG. 8.
FIG. 8.
Distinct pools of H-Ras are differentially induced by RasGRF-activating stimuli. (A) Activation of ER-bound H-Ras by ionomycin. COS-7 cells were cotransfected with M1-H-Ras SS (0.25 μg) in addition to vector (hatched bars) or suboptimal concentrations (s = 0.1 μg) of constructs encoding RasGRF1 (open bars) or RasGRF2 (solid bars), in their wild-type (wt) versions and IQ domain mutant forms (IQ− for RasGRF1, ΔIQ for RasGRF2). After starvation, the cells were treated with 1 μM ionomycin for 5 min where indicated (+) and Ras-GTP levels were determined as described above. Data show means and SEM of at least five independent experiments relative to the Ras-GTP levels detected in control cells. (Lower panel) RasGRF1 and RasGRF2 expression levels as determined by immunoblotting using specific antibodies. (B) Activation of PM-bound CD8-H-Ras SS by ionomycin. (Upper panel) H-Ras-GTP levels from a representative experiment with RasGRF2. Data show means and SEM of at least five independent experiments relative to the Ras-GTP levels detected in control cells. (C) Activation of ER-tethered M1-H-Ras SS by LPA. (Upper panel) H-Ras-GTP levels from a representative experiment with RasGRF2 on activation with 5 μM LPA for 5 min where indicated (+). Data show means and SEM of at least five independent experiments relative to the Ras-GTP levels detected in control cells. (D) Activation of PM-bound CD8-H-Ras SS by LPA. Data show means and SEM of at least five independent experiments relative to the Ras-GTP levels detected in control cells.

Similar articles

Cited by

References

    1. Ajenjo, N., D. S. Aaronson, E. Ceballos, C. Richard, J. León, and P. Crespo. 2000. Myeloid leukemia cell growth and differentiation are independent of mitogen-activated protein kinases ERK1/2 activation. J. Biol. Chem 275:7189-7197. - PubMed
    1. Apolloni, A., I. A. Prior, M. Lindsay, R. G. Parton, and J. F. Hancock. 2000. H-Ras but not K-Ras traffics to the plasma membrane through the exocytic pathway. Mol. Cell Biol. 20:2475-2487. - PMC - PubMed
    1. Arozarena, I., D. S. Aaronson, D. Matallanas, V. Sanz, N. Ajenjo, S. Tenbaum, H. Teramoto, T. Ighishi, J. C. Zabala, J. S. Gutkind, and P. Crespo. 2000. The Rho family GTPase Cdc42 regulates the activation of Ras/MAPK pathway by the exchange factor Ras-GRF. J. Biol. Chem. 275:26441-26448. - PubMed
    1. Arozarena, I., D. Matallanas, and P. Crespo. 2001. Maintenance of Cdc42 GDP-bound state by Rho-GDI inhibits MAP kinase activation by the exchange factor Ras-GRF. J. Biol. Chem. 276:21878-21884. - PubMed
    1. Berridge, M. J., M. D. Bootman, and H. L. Roderick. 2003. Calcium signaling: dynamics homeostasis and remodeling. Nat. Rev. Mol. Cell Biol. 4:517-529. - PubMed

Publication types

MeSH terms