. 2004 Feb;24(4):1640-8.
doi: 10.1128/MCB.24.4.1640-1648.2004.

Dnmt1 expression in pre- and postimplantation embryogenesis and the maintenance of IAP silencing

Affiliations

Dnmt1 expression in pre- and postimplantation embryogenesis and the maintenance of IAP silencing

F Gaudet et al. Mol Cell Biol. 2004 Feb.

Abstract

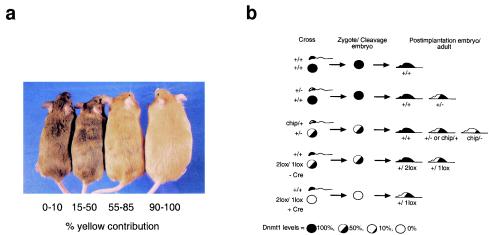
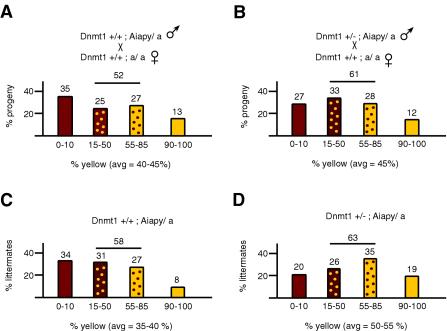
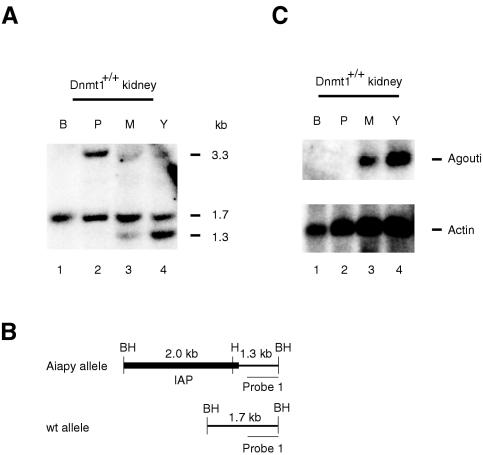
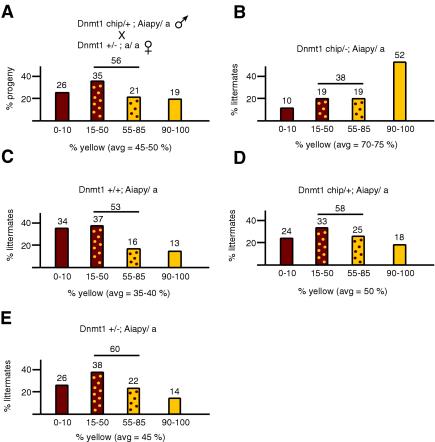
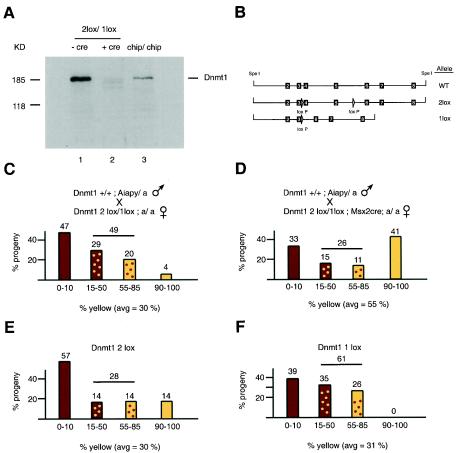
The methylation of intracisternal A-type particle (IAP) sequences is maintained during mouse embryogenesis. Methylation suppresses IAP expression and the potential for mutagenesis by retrotransposition, but it is not clear how methylation of these elements is maintained during the embryonic stages when the bulk of the genome is being demethylated. It has been suggested that the high levels of DNA methyltransferase-1 (Dnmt1) present during cleavage could be important for keeping IAPs methylated. To test this hypothesis, we combined mutant alleles of Dnmt1 with an agouti allele (A(iapy)), which provided a coat color readout for the methylation status of the IAP insertion in the agouti locus. We found that reduction in Dnmt1 levels directly impacted methylation at this locus, leading to stable transcriptional activation of the agouti gene in the adult. Specifically, the short maternal Dnmt1 protein was important in maintaining methylation at the A(iapy) locus in cleavage embryos, whereas the longer Dnmt1 isoform found in somatic cells was important in maintaining IAP methylation during the postimplantation stage. These results underscore the importance of maintaining proper maintenance of methylation patterns during gestation and suggest that interference with this process may stably affect gene expression patterns in the adult and may have profound phenotypic consequences.


Figures

FIG. 1.
FIG. 1.
Coat color of Aiapy mice. (a) Aiapy siblings show a wide degree of expressivity of the agouti gene, resulting in coat colors ranging from pseudoagouti (left) to completely yellow (right). Constitutive expression of the agouti gene also correlates with an obesity phenotype, which can be seen in the solid yellow mouse (28). (b) Relative levels of Dnmt1 in parental gametes and progeny from the crosses performed. The strength of the Dnmt1 mutant alleles relative to wild type (set at 100%) is as follows: Dnmt1+/2lox (100%), Dnmt1chip/+ (60%), Dnmt1+/− (50%), Dnmt1+/1lox (50%), Dnmt12lox/1lox (50%), and Dnmt1chip/− (10%). Wild-type levels of Dnmt1 are indicated by a solid black color. For example, Dnmt1+/− mice, which contain only 50% of wild-type Dnmt1 levels, are depicted as 50% black. The genotypes of the gametes represent the genotype of the parental animals, as gametes are haploid and can carry either allele. The levels of Dnmt1 depicted in the sperm represent expected premeiosis levels, since mature sperm does not contain detectable Dnmt1. Those levels indicate the degree of Dnmt1 levels that the male gamete eventually contributes to the implantation embryo and adult when Dnmt1 expression is turned on. Dnmt1+/− and Dnmt1chip/+ mice are depicted by a 50% black mouse for simplicity but contain, respectively, 50 and 60% of wild-type levels of Dnmt1.
FIG. 2.
FIG. 2.
Distribution of coat color of Aiapy progeny. All results are expressed in terms of the percentage of yellow coat color (x axis). The degree of yellow expression was scored in four different ranges of yellow contribution: 0 to 10%, 15 to 50%, 55 to 85%, and 90 to 100%. The y axis represents the percentage of the progeny which fell in a specific range and is indicated above each group. The total percentage of mottled contribution is indicated over the mottled ranges and represents the percentage of progeny falling in the 15 to 85% range. The average yellow contribution of each panel is indicated and is labeled “avg.” The average determined was the arithmetic average, specifically, the sum of the estimated yellow contribution of each mouse divided by the number of mice. Coat color distribution are shown for progeny from fathers containing wild-type levels of Dnmt1 (A) or heterozygous levels of Dnmt1 (B) bred to C57BL/6 female mice. A wide range of coat color contribution is evident. The distribution in panel B was broken down according to whether the mice were Dnmt1+/+ (C) or Dnmt1+/− (D). Sample sizes (n) were 96 (A), 133 (B), 60 (C), and 73 (D). The genetic background of all mice was C57BL/6.
FIG. 3.
FIG. 3.
Methylation status of the IAP allele correlates with agouti expression and coat color. (A) Southern blot analysis of kidney tissues from black (B), pseudoagouti (P), mottled (M), and yellow (Y) animals. The methylation-sensitive restriction enzyme HpaII (H) in combination with BamHI (BH) was used to detect the methylation status of the 5′ LTR of the IAP. The wild-type allele does not contain a HpaII site yielding a fragment of 1.7 kb (see schematic diagram in panel B). Depending on the methylation status of the 5′ LTR, the Aiapy allele will yield a 1.3-kb fragment if unmethylated or a 3.3-kb fragment if methylated. Because the mice were heterozygous for the Aiapy allele, a wild-type 1.7-kb fragment was observed in all samples. All three fragments are indicated on the right side of the panel. A clear correlation between Aiapy hypomethylation and coat color can be observed. (B) Schematic diagram of the fragment sizes predicted from the Aiapy and wild-type alleles. (C) Northern blot analysis of total RNA from black (B), pseudoagouti (P), mottled (M), and yellow (Y) mice hybridized to an agouti probe. A clear correlation between methylation (panel A) and expression at the 5′ LTR of the IAP can be seen. The agouti mRNA is 692 bases. As a loading control, an actin probe was used on the same blot (lower panel).
FIG. 4.
FIG. 4.
Coat color distribution from parents containing low levels of Dnmt1. The progeny resulting from the cross in panel A was plotted according to the respective genotypes (B to E). Sample sizes (n) were 155 (A), 21 (B), 38 (C), 51 (D), and 45 (E). A clear switch to yellow coat color can be seen in Dnmt1chip/− animals (B). The genetic background of the mice was mostly C57BL/6 but contained small amounts of 129 and BALB/c, which came from the Dnmt1chip allele.
FIG. 5.
FIG. 5.
Coat color distribution of progeny from mothers with reduced Dnmt1o. (A) Immunoblot of 10 oocytes from Dnmt12lox/1lox; a/a females without Msx2Cre (lane 1) or with Msx2Cre (lane 2) and from females homozygous for the hypomorphic Dnmt1chip allele (lane 3). A C-terminal Dnmt1 antibody was used. The predicted size of the oocyte form is 170 kDa. (B) Schematic diagram of the Dnmt12lox (2lox) and Dnmt11lox (1lox) alleles compared to the wild-type allele (WT). The exons are indicated by the black boxes and corresponding exon numbers, and the loxP sites are indicated by arrowheads. The 1lox allele contains a deletion of genomic sequences that includes exons 4 and 5. (C and D) Coat color distribution of progeny from Dnmt1+/+; Aiapy/a fathers and Dnmt12lox/1lox; a/a mothers without Msx2Cre (C) or heterozygous for Msx2Cre (D). Sample sizes (n) were 45 (C) and 27 (D); P = 0.004. The background of the mice was mostly C57BL/6 but contained small contributions from FVB and 129, which came from the 2lox, 1lox, and Msx2Cre alleles. (E and F) The progeny in panel C were broken down according to whether they were Dnmt12lox (E) or Dnmt11lox (F).

References

    1. Bourc'his, D., G. L. Xu, C. S. Lin, B. Bollman, and T. H. Bestor. 2001. Dnmt3L and the establishment of maternal genomic imprints. Science 294:2536-2539. - PubMed
    1. Carlson, L. L., A. W. Page, and T. H. Bestor. 1992. Properties and localization of DNA methyltransferase in preimplantation mouse embryos: implications for genomic imprinting. Genes Dev. 6:2536-2541. - PubMed
    1. Chen, R. Z., U. Pettersson, C. Beard, L. Jackson-Grusby, and R. Jaenisch. 1998. DNA hypomethylation leads to elevated mutation rates. Nature 395:89-93. - PubMed
    1. Cooney, C. A., A. A. Dave, and G. L. Wolff. 2002. Maternal methyl supplements in mice affect epigenetic variation and DNA methylation of offspring. J. Nutr. 132:2393S-2400S. - PubMed
    1. Duhl, D. M., H. Vrieling, K. A. Miller, G. L. Wolff, and G. S. Barsh. 1994. Neomorphic agouti mutations in obese yellow mice. Nat. Genet. 8:59-65. - PubMed

Publication types

MeSH terms

Substances