. 2004 Jan 28;24(4):895-906.
doi: 10.1523/JNEUROSCI.4420-03.2004.

The activation mechanism of alpha1 homomeric glycine receptors

Affiliations

The activation mechanism of alpha1 homomeric glycine receptors

Marco Beato et al. J Neurosci. .

Abstract

The glycine receptor mediates fast synaptic inhibition in the spinal cord and brainstem. Its activation mechanism is not known, despite the physiological importance of this receptor and the fact that it can serve as a prototype for other homopentameric channels. We analyzed single-channel recordings from rat recombinant alpha1 glycine receptors by fitting different mechanisms simultaneously to sets of sequences of openings at four glycine concentrations (10-1000 microm). The adequacy of the mechanism and the rate constants thus fitted was judged by examining how well these described the observed dwell-time distributions, open-shut correlation, and single-channel P(open) dose-response curve. We found that gating efficacy increased as more glycine molecules bind to the channel, but maximum efficacy was reached when only three (of five) potential binding sites are occupied. Successive binding steps are not identical, implying that binding sites can interact while the channel is shut. These interactions can be interpreted in the light of the topology of the binding sites within a homopentamer.


Figures

Figure 3.
Figure 3.
Schematic representation showing the names of the rate constants of some of the mechanisms of receptor activation that were fitted to the single-channel data.
Figure 8.
Figure 8.
Schematic representation of a mechanism of activation in which there are two distinct diliganded states. This scheme was fitted with and without the fourth and fifth binding, which are shown in gray (see Results).
Figure 2.
Figure 2.
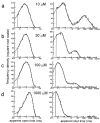
ad, Dwell-time distributions for cell-attached recordings at increasing glycine concentrations. Both open-time and shut-time distributions were fitted with mixtures of exponential components. The results are given in Tables 1 and 2.
Figure 4.
Figure 4.
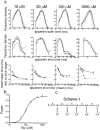
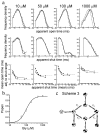
a, HJC fitting of Scheme 1 (five binding sites constrained to be the same, c) to data from patches at four different glycine concentrations. The distributions (smooth lines superimposed on the open-time and shut-time histograms; top two rows of plots) are calculated from the mechanism rate constants simultaneously fitted to the entire sequence of events at the different agonist concentrations. Solid lines are predicted (HJC) dwell-time distributions corrected for missed events, whereas dashed lines are the distributions expected if no events were missed. The accuracy of the fit in predicting the negative correlation between the length of an opening and the length of the adjacent shut time was tested by the conditional mean plots (third row). Mean open time for openings that are adjacent to shut times in specified ranges (ordinate) are plotted against the mean of the shut times in each range (abscissa). Experimental observations are shown as filled diamonds, ±SD of the mean, and are joined by solid lines. The corresponding values calculated from the fitted rate constants are displayed as filled circles. The dashed line shows the theoretical continuous relationship between open time and adjacent shut time. Note the poor agreement with experimental data, particularly for the shut-time distributions and the correlations at high concentration. b, The bottom plot shows the same cluster Popen values as Figure 1d. The solid line is the equilibrium dose–response relationship predicted by the fitted rate constants and the mechanism (note that this relationship is not a Hill equation and that it is not directly fitted to the data points). c, Scheme fitted to the data. The binding sites are constrained to be equal, and this is indicated by the same equilibrium constant (K) over the binding steps.
Figure 5.
Figure 5.
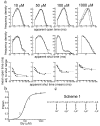
a, HJC fitting of Scheme 1 (5 interacting binding sites, c) to data from patches at four different glycine concentrations. As in Figure 4, the plots show how well the fitted rate constants with this mechanism predict the experimental observations, whether they are open-time and shut-time distributions (top two rows) or open–shut correlations (third row). Note that the substantial improvement in the description of dwell times and correlations is associated with a marked failure in the description of the slope of the Popen dose–response curve (b).
Figure 6.
Figure 6.
a, HJC fitting of Scheme 2 (3 independent binding sites) to data from patches at four different glycine concentrations. As in Figures 4 and 5, the plots show how well the rate constants fitted with this mechanism predict the experimental observations. Note the overall good quality of the predicted distributions or relationships with the experimental data shown in the plots. b, Popen dose–response curve calculated from the fitted rate constants of Scheme 2 (c).
Figure 7.
Figure 7.
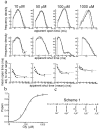
a, HJC fitting of Scheme 1 in the hypothesis of saturation of gating after the third agonist molecule is bound (this is indicated in c by the same gating constant (E) displayed over these gating steps). The agreement of the HJC distributions with the data is excellent. b, The Popen curve generated by the fitted rates describes the data well.
Figure 9.
Figure 9.
HJC fitting of Scheme 3, which incorporates two distinct independent diliganded shut states (compare Fig. 3), to data from patches at four different glycine concentrations (a, b). As in Figure 4, the plots show how well the fitted rate constants with this mechanism predict the experimental observations. Note the overall good agreement of the description of the different categories of data; this is similar to the quality of the predictions of Scheme 2 (Fig. 6). c, Interpreting the relationship between binding kinetics and state of ligation for a homomeric receptor. The mechanism shown here is the same as the scheme in Figure 8 but adds a realistic interpretation of the binding cooperativity, in view of the possible arrangements of binding sites. Each of the five circles represents a binding site, which can be either empty (open circle) or occupied by agonist (filled circle); open states of the channel are indicated by a shaded pore in the middle of the pentamer. The constraints used in the fits are indicated by the binding constants (either Kc or Kd) displayed over the second and third binding steps.
Figure 1.
Figure 1.
Clustering of α1 glycine receptor openings at increasing agonist concentrations. a–c, Continuous sweeps recorded in the cell-attached patch configuration showing channel openings elicited by 10, 100, and 1000 μm glycine in the recording electrode. The sweeps shown to the right of b and c are expanded displays of two clusters in the continuous record (indicated by a bar under the recording). The arrow in the expanded time scale trace of c marks an example of a long (∼5 ms) shut state within the cluster. Note that bursts of openings are observed at the lower concentration; at the higher agonist concentrations, these bursts group into progressively longer clusters with increasing Popen. d shows a Popen dose–response curve. Popen values are obtained for each cluster from the ratio between total open time (obtained from records idealized by time course fitting) and total duration. The points shown are the averages of 34–50 clusters for each glycine concentration. Here, these points are fitted by a Hill equation (solid line).

References

    1. Amin J, Weiss DS (1996) Insights into the activation mechanism of ρ1 GABA receptors obtained by coexpression of wild type and activation impaired subunits. Proc R Soc Lond B Biol Sci 263: 273–282. - PubMed
    1. Auerbach A (1993) A statistical analysis of acetylcholine receptor activation in Xenopus myocytes: stepwise versus concerted models of gating. J Physiol (Lond) 461: 339–378. - PMC - PubMed
    1. Beato M, Groot-Kormelink PJ, Colquhoun D, Sivilotti LG (2002) Openings of the rat recombinant α1 homomeric glycine receptor as a function of the number of agonist molecules bound. J Gen Physiol 119: 443–466. - PMC - PubMed
    1. Bormann J, Rundström N, Betz H, Langosch D (1993) Residues within transmembrane segment M2 determine chloride conductance of glycine receptor homo- and hetero-oligomers. EMBO J 12: 3729–3737. - PMC - PubMed
    1. Brejc K, van Dijk WJ, Klaassen RV, Schuurmans M, van der Oost J, Smit AB, Sixma TK (2001) Crystal structure of an ACh-binding protein reveals the ligand-binding domain of nicotinic receptors. Nature 411: 269–276. - PubMed

Publication types

MeSH terms

LinkOut - more resources