. 2004 Jan 28;24(4):972-81.
doi: 10.1523/JNEUROSCI.4317-03.2004.

Dopamine neurons mediate a fast excitatory signal via their glutamatergic synapses

Affiliations

Dopamine neurons mediate a fast excitatory signal via their glutamatergic synapses

Nao Chuhma et al. J Neurosci. .

Abstract

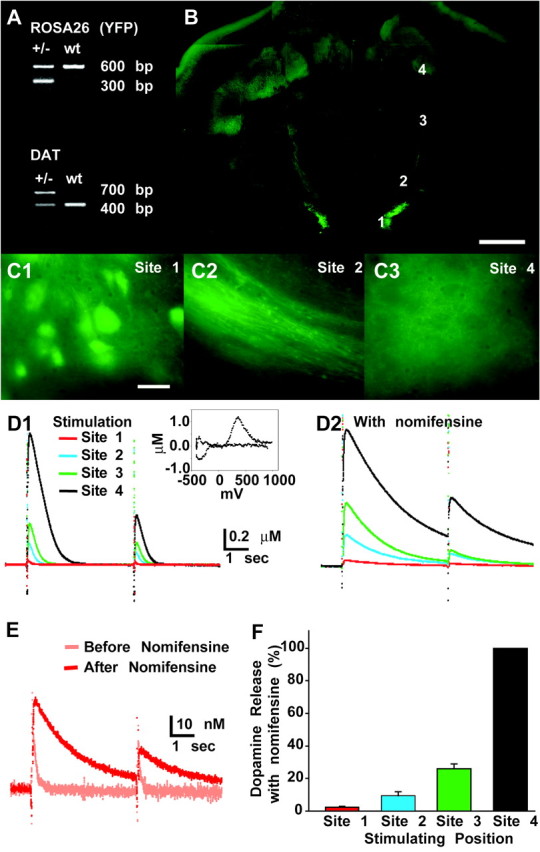
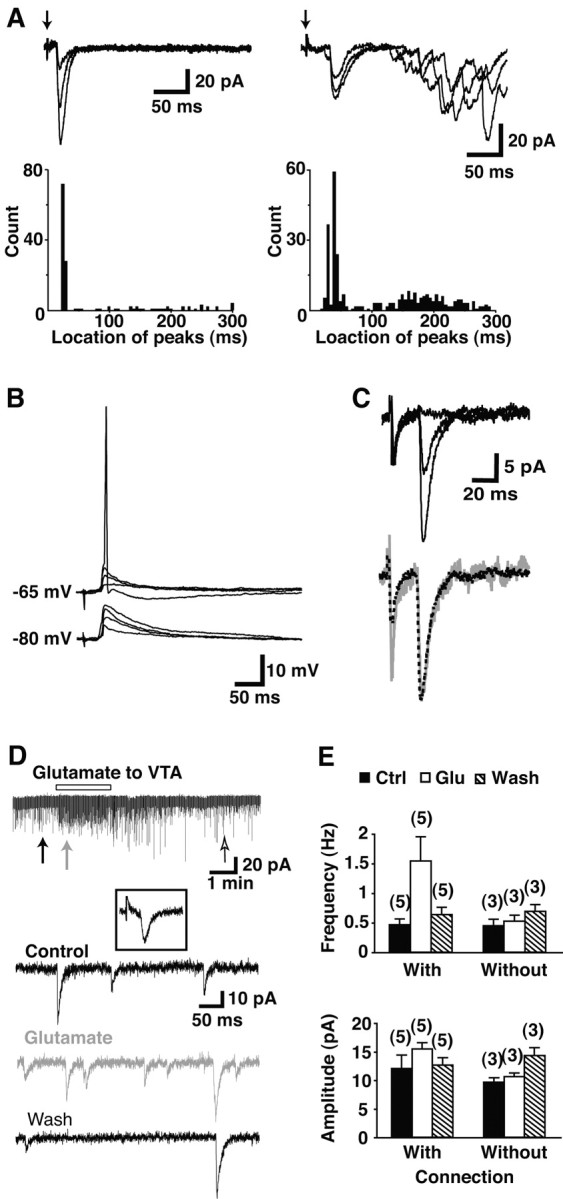
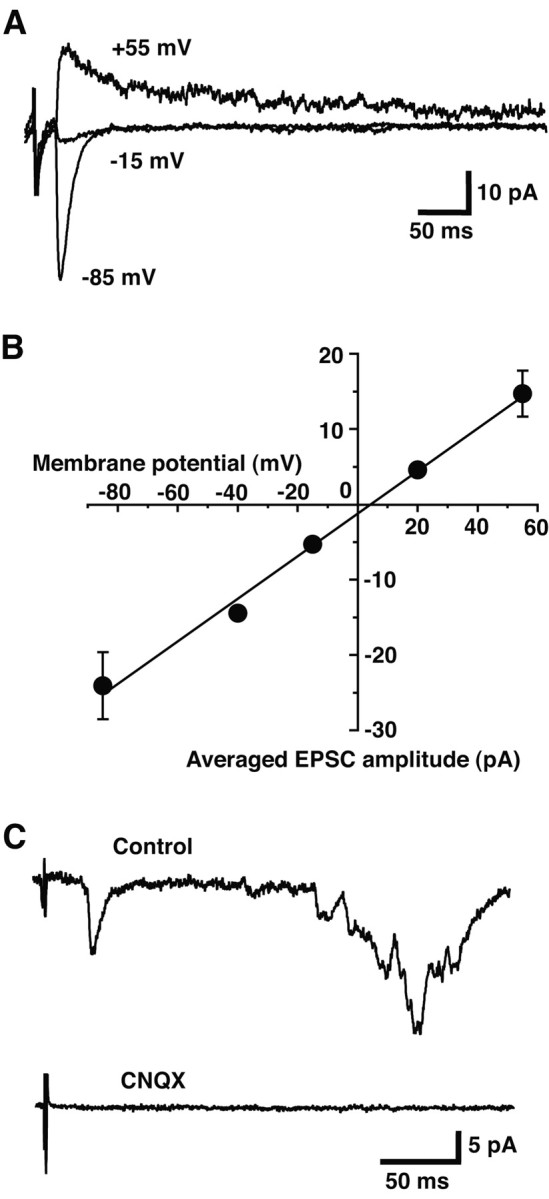
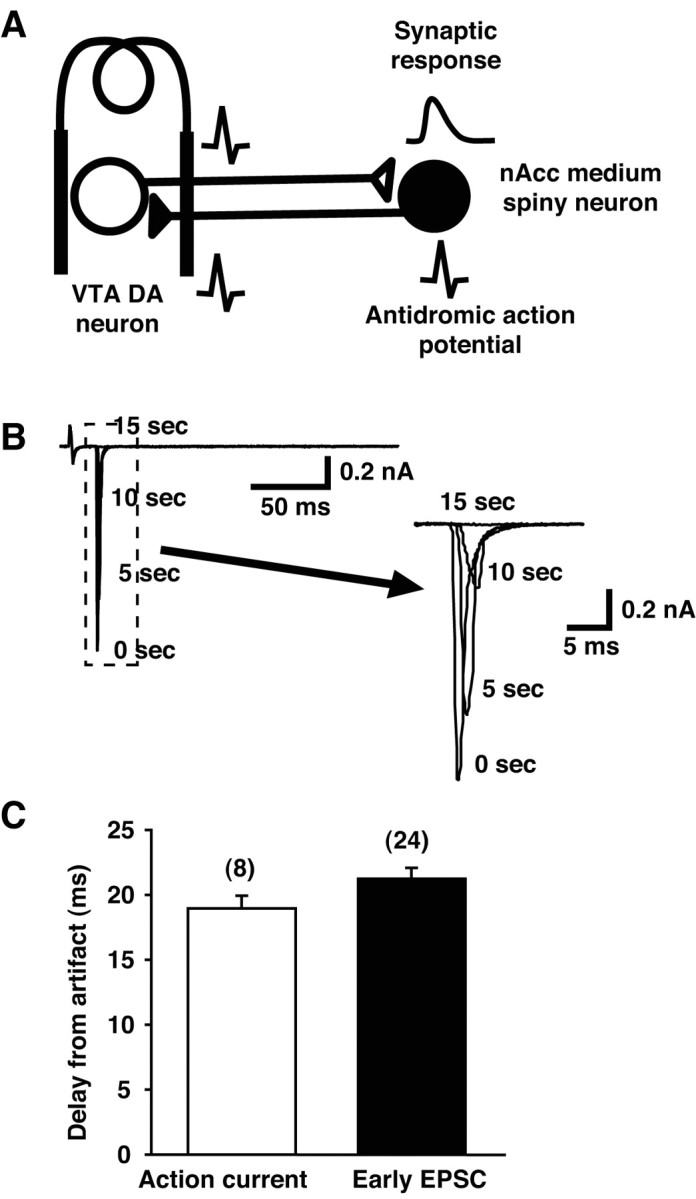
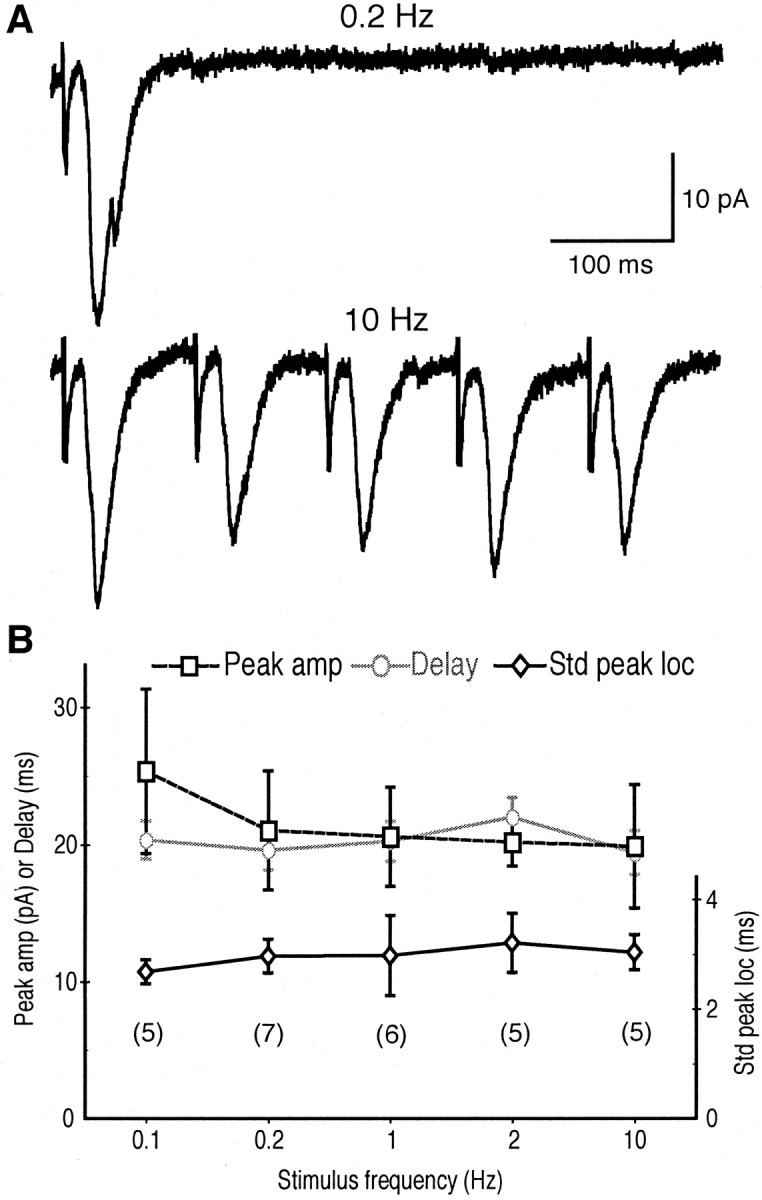
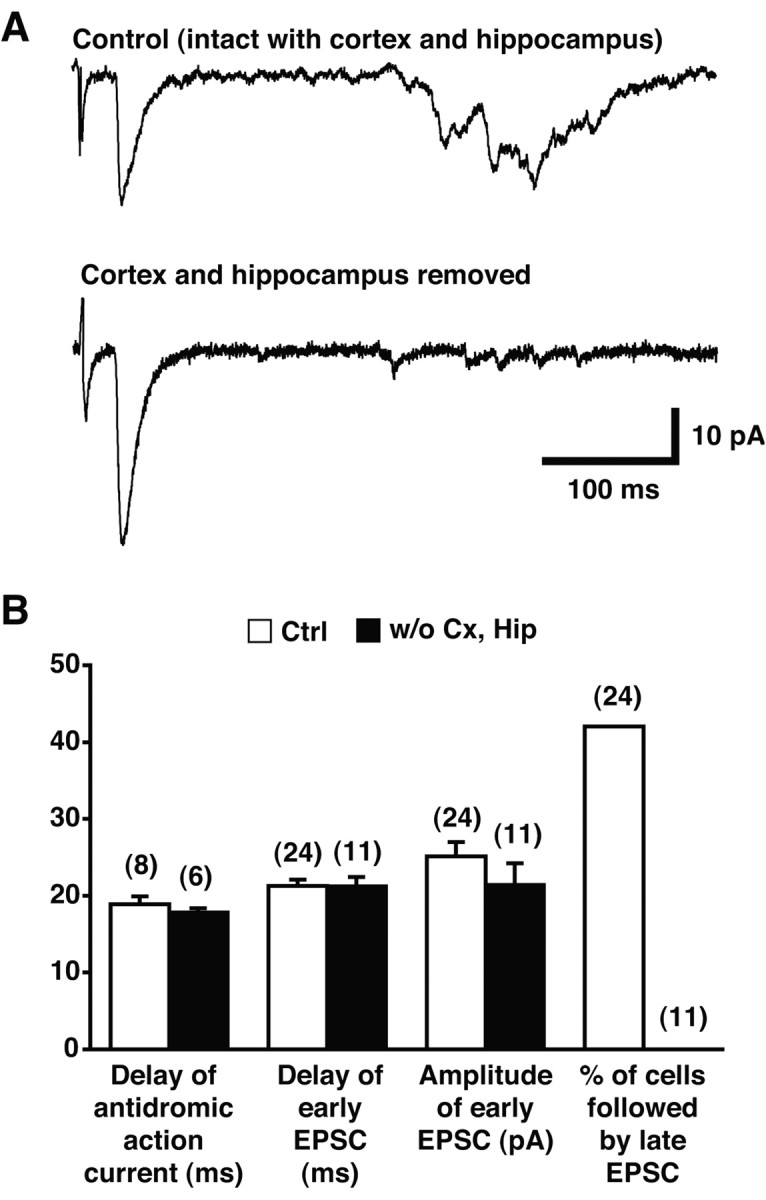
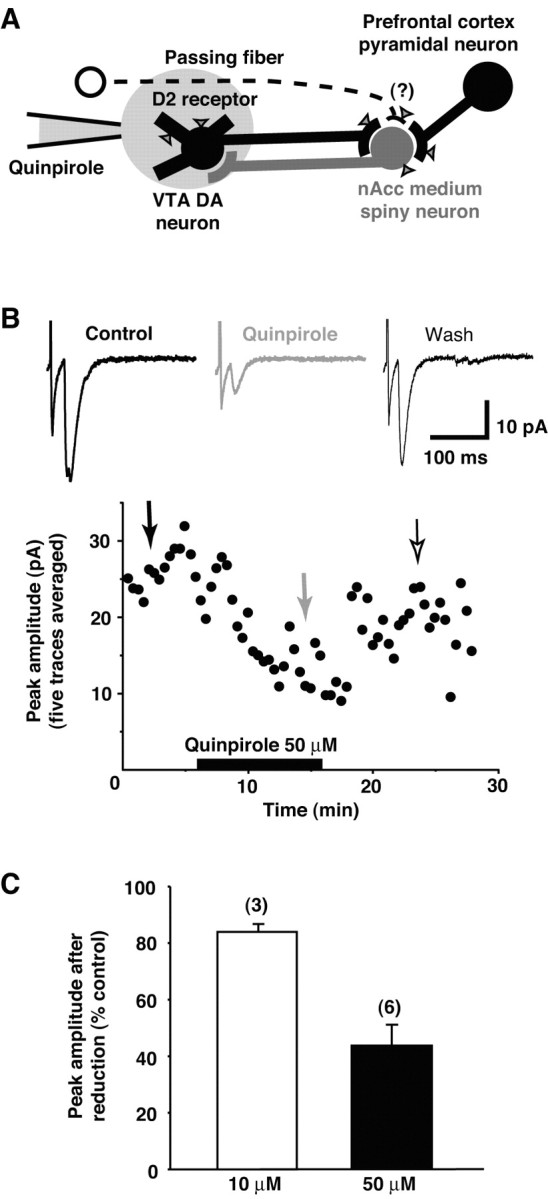
Dopamine neurons are thought to convey a fast, incentive salience signal, faster than can be mediated by dopamine. A resolution of this paradox may be that midbrain dopamine neurons exert fast excitatory actions. Using transgenic mice with fluorescent dopamine neurons, in which the axonal projections of the neurons are visible, we made horizontal brain slices encompassing the mesoaccumbens dopamine projection. Focal extracellular stimulation of dopamine neurons in the ventral tegmental area evoked dopamine release and early monosynaptic and late polysynaptic excitatory responses in postsynaptic nucleus accumbens neurons. Local superfusion of the ventral tegmental area with glutamate, which should activate dopamine neurons selectively, produced an increase in excitatory synaptic events. Local superfusion of the ventral tegmental area with the D2 agonist quinpirole, which should increase the threshold for dopamine neuron activation, inhibited the early response. So dopamine neurons make glutamatergic synaptic connections to accumbens neurons. We propose that dopamine neuron glutamatergic transmission may be the initial component of the incentive salience signal.


Figures

Figure 1.
Figure 1.
DA release in brain slices from DAT-YFP mice. A, PCR genotyping of DAT-YFP mice. The presence of ROSA26-YFP cassette gave a 300 bp band, whereas the wild-type (wt) band was 600 bp; the presence of a DAT-Cre cassette gave a 700 bp band, whereas the wt band was 400 bp. B, Fluorescence image of a complete 500 μm horizontal slice encompassing the mesoaccumbens projection at P20 (all experiments were done on hemislices, split at the midline). Scale bar, 1 mm. C, Expanded image from another slice (P19) of DA neuron cell bodies in the VTA (C1), DA axons in MFB, (C2) and DA neuron terminal distribution in the nAcc (C3). The approximate location of each expanded image in the slice is indicated by the numbers in B. Scale bar, 20μm. D, E, Amperometric recordings of evoked DA release in nAcc (all recordings made at site 4 in B). Stimulation was applied at the four sites, extending from the VTA to the nAcc, as indicated in B. All traces are from the same slice. D1, DA release without nomifensine. A cyclic voltammogram recorded at site 4 is shown in the inset. D2, DA release in the presence of nomifensine (10μm; 10 min). Calibration same as in D1. E, Expanded amperometric traces of VTA-evoked DA release before and after nomifensine. F, Summary of normalized evoked DA release in the nAcc versus the site of stimulation with nomifensine (5 hemislices from 3 mice).
Figure 2.
Figure 2.
Synaptic responses evoked in nAcc medium-spiny neurons by VTA stimulation. A–C, Electrical stimulation of the VTA. A, In each of two hemislices, local field stimulation was delivered to the VTA with a bipolar electrode (arrow indicates stimulus artifact), whereas recording from an nAcc neuron clamped to –85 mV; three superimposed traces are shown. In one hemislice, just an early response was seen (left), whereas in another both an early and a late response were seen (right). A peak location histogram for each cell is shown below the traces (n = 100 traces, left; n = 120 traces, right). B, Under current clamp, VTA stimulation evoked EPSPs capable of firing the nAcc neuron when it was in the up state, here mimicked by a 20 mV depolarization (4 traces are superimposed). C, The early EPSC did not change shape with increasing stimulus intensity. nAcc responses were evoked by 0.7, 0.9, and 1 mA stimulation (top traces, each the average of 10 traces). When the 0.9 mA-induced response (gray line) was scaled to the same peak amplitude as the 1 mA-induced trace (black dotted line), the traces exactly superimposed. D, E, Chemical stimulation of the VTA. VTA neurons were activated by the local application of glutamate (1 mm), pressure-ejected from a patch pipette. D, Time course and representative traces before (control), during local application of glutamate, and after (wash). Downward spikes are synaptic events. Arrows indicate sampling points for the representative traces. The inset shows the early response in the same cell induced by the electrical stimulation of the VTA, confirming that there was an intact VTA–nAcc synaptic connection. The calibration is the same as for the representative traces. E, Comparison of the effects of the local application of glutamate on the frequency (top) and average amplitude of synaptic events (bottom) between cells with intact VTA-nAcc synaptic connections (left) and those without (right). The numbers of the recorded cells are indicated in parentheses.
Figure 3.
Figure 3.
Recorded synaptic responses are glutamatergic. A, EPSCs were evoked by VTA stimulation while holding the postsynaptic nAcc neuron at –85, –15, and +55 mV (average of 10 traces is shown). B, Current–voltage plot shows a reversal potential of 2.1 mV, characteristic of a glutamatergic response (line is a least-squares linear regression fit; r = 0.99). Points at –85, –15, and +55 mV were from four cells; additional points at –40 and +20 mV were added from one cell. C, Both early and late responses were completely blocked by CNQX (40μm; 5 min; average of 10 traces).
Figure 4.
Figure 4.
Latency of early response is short. A, DA neurons in the VTA and nAcc medium-spiny neurons make reciprocal synaptic connections, so stimulation of the VTA generates orthodromic action potentials in DA neuron axons and antidromic action potentials in nAcc medium-spiny neuron axons. B, A sample of antidromic action current recorded in nAcc medium-spiny neuron. The action current was rapidly and progressively blocked by the QX-314 in the recording pipette. Times after starting stimulation (0, 5, 10, and 15 sec) are indicated; an expanded view is shown to the right. C, The delay to the antidromic action currents and the early EPSC were nearly identical (numbers of recorded cells are in parentheses), indicating that the early response is monosynaptic.
Figure 5.
Figure 5.
Reliability of early response is consistent with monosynapticity. A, Representative traces of the early response evoked at 0.2 Hz (top) and 10 Hz (bottom) from the same nAcc cell (average of 10 traces). B, Effects of increasing stimulus frequency on the average peak amplitude of the early EPSC (squares; left axis), the latency (circles; left axis), and SD of peak location (diamonds; right axis), showing no frequency dependence, as expected for a monosynaptic response. The numbers of cells recorded are indicated under the data points.
Figure 6.
Figure 6.
Late response requires intact cortical circuits. A, Representative traces in control hemislice (top) and the paired hemislice in which the cortex and hippocampus were removed (bottom; average of 10 traces). B, The delay of the antidromic action current, the delay of the early response, and the peak amplitude of the early response were not different between control (white columns) and after removal (black columns), whereas the late response was never seen in slices after removal. The numbers of recorded cells are indicated in parentheses. The graph includes results from paired and nonpaired hemislices.
Figure 7.
Figure 7.
Local application of quinpirole in VTA inhibits early response. A, Local application of quinpirole to the VTA should reduce the early response if it arises from DA neurons, because D2 receptors (indicated by triangles) are present solely on DA neurons in the VTA. B, Local application of quinpirole selectively reduced the amplitude of the early response. The time course and representative traces (at time points indicated by arrows) during local application of quinpirole (50 μm) are shown for a representative experiment. Each point in the graph is the average of five traces; electrophysiological records are the average of 10 traces. C, Increasing the quinpirole concentration increased the inhibitory effect, further confirming that the early response arises from DA neurons. The abscissa indicates the quinpirole concentration. The numbers of recorded cells are shown in parentheses.

References

    1. Andersen SL, Gazzara RA (1994) The development of D2 autoreceptor-mediated modulation of K+-evoked dopamine release in the neostriatum. Brain Res Dev Brain Res 78: 123–130. - PubMed
    1. Benoit-Marand M, Jaber M, Gonon F (2000) Release and elimination of dopamine in vivo in mice lacking the dopamine transporter: functional consequences. Eur J Neurosci 12: 2985–2992. - PubMed
    1. Benoit-Marand M, Borrelli E, Gonon F (2001) Inhibition of dopamine release via presynaptic D2 receptors: time course and functional characteristics in vivo J Neurosci 21: 9134–9141. - PMC - PubMed
    1. Berg-Johnsen J, Langmoen IA (1992) Temperature sensitivity of thin unmyelinated fibers in rat hippocampal cortex. Brain Res 576: 319–321. - PubMed
    1. Berry MS, Pentreath VW (1976) Criteria for distinguishing between monosynaptic and polysynaptic transmission. Brain Res 105: 1–20. - PubMed

Publication types

MeSH terms