. 2004 Jan 15;18(2):184-95.
doi: 10.1101/gad.1149604.

Rad6 plays a role in transcriptional activation through ubiquitylation of histone H2B

Affiliations

Rad6 plays a role in transcriptional activation through ubiquitylation of histone H2B

Cheng-Fu Kao et al. Genes Dev. .

Abstract

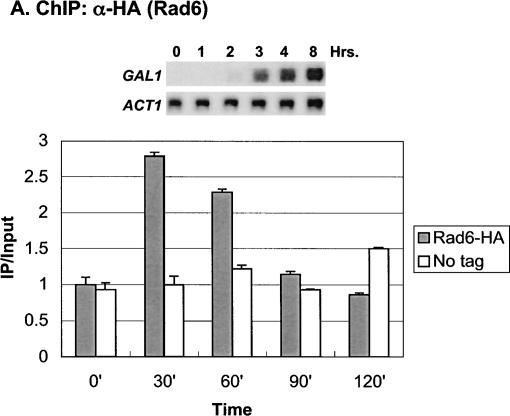
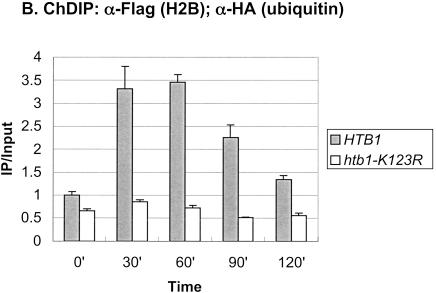
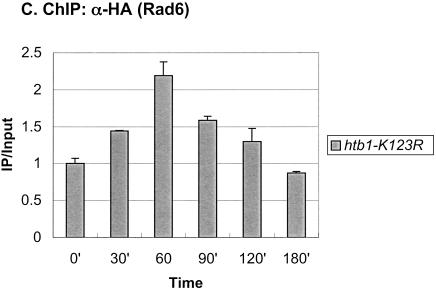
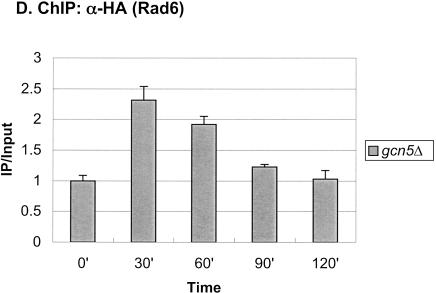
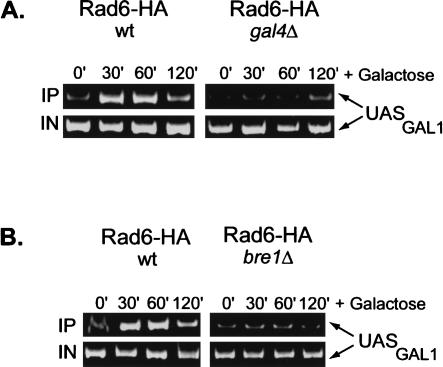
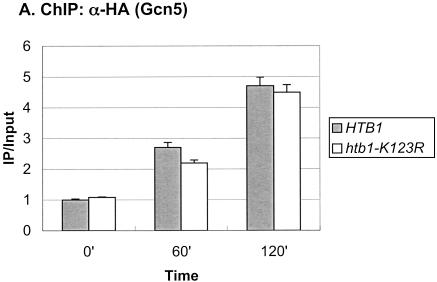
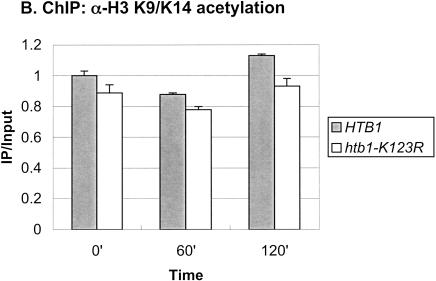
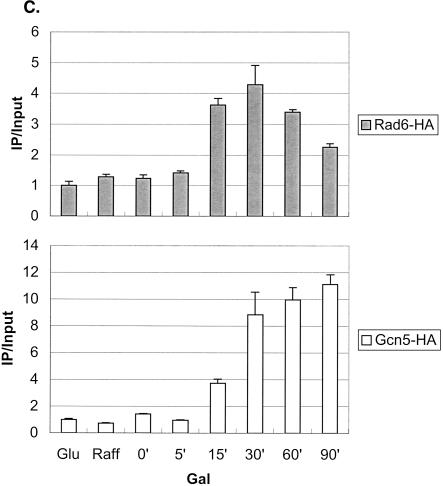
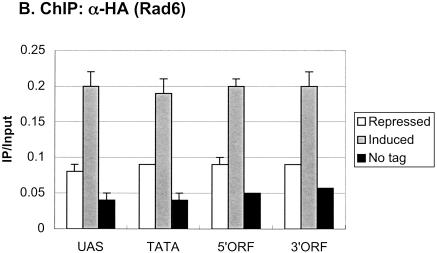
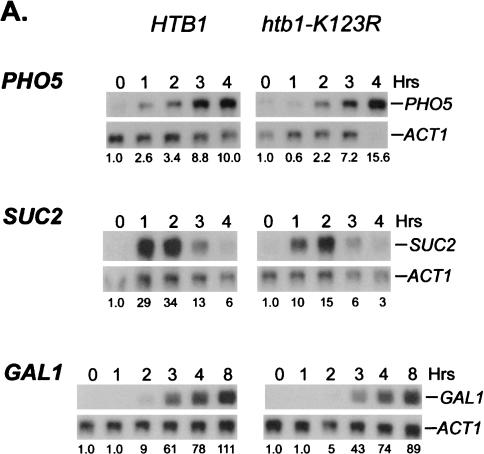
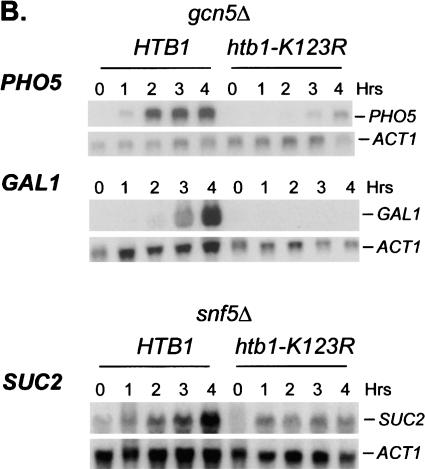
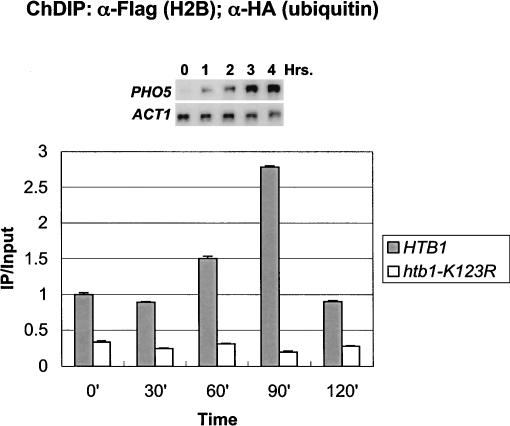
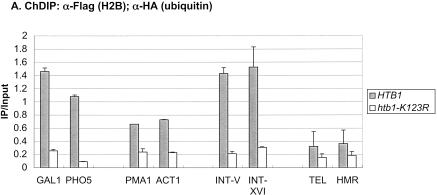
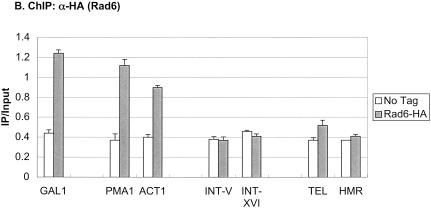
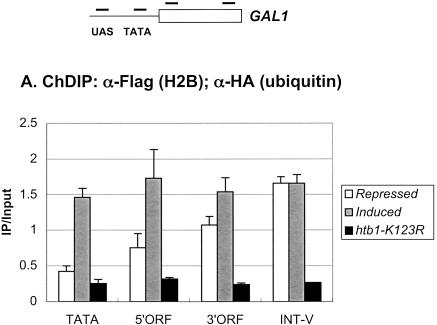
Covalent modifications of the histone N tails play important roles in eukaryotic gene expression. Histone acetylation, in particular, is required for the activation of a subset of eukaryotic genes through the targeted recruitment of histone acetyltransferases. We have reported that a histone C tail modification, ubiquitylation of H2B, is required for optimal expression of several inducible yeast genes, consistent with a role in transcriptional activation. H2B was shown to be ubiquitylated and then deubiquitylated at the GAL1 core promoter following galactose induction. We now show that the Rad6 protein, which catalyzes monoubiquitylation of H2B, is transiently associated with the GAL1 promoter upon gene activation, and that the period of its association temporally overlaps with the period of H2B ubiquitylation. Rad6 promoter association depends on the Gal4 activator and the Rad6-associated E3 ligase, Bre1, but is independent of the histone acetyltransferase, Gcn5. The SAGA complex, which contains a ubiquitin protease that targets H2B for deubiquitylation, is recruited to the GAL1 promoter in the absence of H2B ubiquitylation. The data suggest that Rad6 and SAGA function independently during galactose induction, and that the staged recruitment of these two factors to the GAL1 promoter regulates the ubiquitylation and deubiquitylation of H2B. We additionally show that both Rad6 and ubiquitylated H2B are absent from two regions of transcriptionally silent chromatin but present at genes that are actively transcribed. Thus, like histone H3 lysine 4 and lysine 79 methylation, two modifications that it regulates, Rad6-directed H2B ubiquitylation defines regions of active chromatin.


Figures

Figure 1.
Figure 1.
Rad6 is transiently associated with the GAL1 promoter. (A) Strains YKH010 (Rad6-HA HTB1) and JR5-2A (No tag control HTB1) were grown in YPD medium and shifted to YP + 2% galactose medium, and chromatin immunoprecipitation (ChIP) was performed with anti-HA antibodies at the indicated times. PCR analysis in real time was used to measure the abundance of GAL1 UAS sequences in immunoprecipitated (IP) DNA relative to input DNA. The Northern blot inset is from Figure 7A. (B) Strains YKH045 (Flag-HTB1; HA-ubiquitin) and YKH046 (Flag-htb1-K123; HA-ubiquitin) were grown as described in panel A. Chromatin double immunoprecipitation (ChDIP) was sequentially performed with anti-Flag and anti-HA antibodies, and PCR in real time was used to measure the abundance of GAL1 core promoter sequences in the IP DNA (α-HA) relative to input DNA (α-Flag). The data were normalized to the IP/Input ratios for INT-V, which is not regulated by galactose and thus served as a control. (C,D) Strains YKH017 (Rad6-HA htb1-K123R) and YCH001 (Rad6-HA HTB1 gcn5Δ) were grown as described in panel A, and ChIP was performed with anti-HA antibodies, followed by PCR analysis in real time using primers that detect the GAL1 UAS sequences.
Figure 1.
Figure 1.
Rad6 is transiently associated with the GAL1 promoter. (A) Strains YKH010 (Rad6-HA HTB1) and JR5-2A (No tag control HTB1) were grown in YPD medium and shifted to YP + 2% galactose medium, and chromatin immunoprecipitation (ChIP) was performed with anti-HA antibodies at the indicated times. PCR analysis in real time was used to measure the abundance of GAL1 UAS sequences in immunoprecipitated (IP) DNA relative to input DNA. The Northern blot inset is from Figure 7A. (B) Strains YKH045 (Flag-HTB1; HA-ubiquitin) and YKH046 (Flag-htb1-K123; HA-ubiquitin) were grown as described in panel A. Chromatin double immunoprecipitation (ChDIP) was sequentially performed with anti-Flag and anti-HA antibodies, and PCR in real time was used to measure the abundance of GAL1 core promoter sequences in the IP DNA (α-HA) relative to input DNA (α-Flag). The data were normalized to the IP/Input ratios for INT-V, which is not regulated by galactose and thus served as a control. (C,D) Strains YKH017 (Rad6-HA htb1-K123R) and YCH001 (Rad6-HA HTB1 gcn5Δ) were grown as described in panel A, and ChIP was performed with anti-HA antibodies, followed by PCR analysis in real time using primers that detect the GAL1 UAS sequences.
Figure 2.
Figure 2.
Rad6 recruitment to the GAL1 promoter requires the Gal4 activator and the Bre1 E3 ligase. After a shift to YP + galactose medium, ChIP and conventional PCR analysis were carried out in a RAD6-HA HTB1 strain that contained wild-type genes and (A) gal4Δ (YCH001) or (B) bre1Δ (YCH002) deletions. The PCR reactions were electrophoresed on a 10% acrylamide gel, which was stained with ethidium bromide. All reactions were performed in the linear range of amplification.
Figure 3.
Figure 3.
Rad6 and SAGA show different patterns of association with the GAL1 promoter. (A) Strains carrying Gcn5-HA and either HTB1 (YKH012) or htb1-K123R (YKH019) were subjected to ChIP and PCR analysis in real time as described in the legend to Figure 1A before and after a shift to YP + galactose medium. (B) ChIP was performed with anti-H3 K9/K14 acetylation antibodies in strains Y131 (HTB1) and Y133 (htb1-K123R) before and after a shift to YP + galactose medium, and the DNA was analyzed by PCR in real time to determine the levels of H3 acetylation at the GAL1 core promoter. (C) ChIP was performed with anti-HA antibodies in strains YKH010 (Rad6-HA HTB1) and YKH0112 (Gcn5-HA HTB1) during growth in YPD (Glu), after 2 h in YP + 2% raffinose (Raff), and at the indicated times after galactose was added to a final concentration of 2%. PCR in real time was performed to measure the association of Rad6 and Gcn5 with the GAL1 UAS. The data in each panel were normalized to the IP/Input ratio of the INT-V control sequences.
Figure 3.
Figure 3.
Rad6 and SAGA show different patterns of association with the GAL1 promoter. (A) Strains carrying Gcn5-HA and either HTB1 (YKH012) or htb1-K123R (YKH019) were subjected to ChIP and PCR analysis in real time as described in the legend to Figure 1A before and after a shift to YP + galactose medium. (B) ChIP was performed with anti-H3 K9/K14 acetylation antibodies in strains Y131 (HTB1) and Y133 (htb1-K123R) before and after a shift to YP + galactose medium, and the DNA was analyzed by PCR in real time to determine the levels of H3 acetylation at the GAL1 core promoter. (C) ChIP was performed with anti-HA antibodies in strains YKH010 (Rad6-HA HTB1) and YKH0112 (Gcn5-HA HTB1) during growth in YPD (Glu), after 2 h in YP + 2% raffinose (Raff), and at the indicated times after galactose was added to a final concentration of 2%. PCR in real time was performed to measure the association of Rad6 and Gcn5 with the GAL1 UAS. The data in each panel were normalized to the IP/Input ratio of the INT-V control sequences.
Figure 7.
Figure 7.
H2B ubiquitylation has overlapping functions with chromatin remodeling factors. (A) Cells from strain JR5-2A that contained either wild-type HTB1 or the htb1-K123R allele were shifted from YPD medium to: no phosphate synthetic medium (PHO5), YP medium + 2% galactose (GAL1), or YP medium + 0.05% glucose (SUC2) for the indicated times. Northern blot analysis was performed with the indicated probes. The numbers beneath each lane represent transcript levels normalized to ACT1 mRNA. (B) Northern blot analysis was performed in gcn5Δ (JR7-2B) or snf5Δ (JR16-6A) mutants that contained either wild-type HTB1 or the htb1-K123R allele after cells were shifted to the media described in panel A. The SUC2 blot was overexposed to show the effect of the htb1-K123R mutation on residual SUC2 mRNA accumulation in the snf5Δ mutant.
Figure 7.
Figure 7.
H2B ubiquitylation has overlapping functions with chromatin remodeling factors. (A) Cells from strain JR5-2A that contained either wild-type HTB1 or the htb1-K123R allele were shifted from YPD medium to: no phosphate synthetic medium (PHO5), YP medium + 2% galactose (GAL1), or YP medium + 0.05% glucose (SUC2) for the indicated times. Northern blot analysis was performed with the indicated probes. The numbers beneath each lane represent transcript levels normalized to ACT1 mRNA. (B) Northern blot analysis was performed in gcn5Δ (JR7-2B) or snf5Δ (JR16-6A) mutants that contained either wild-type HTB1 or the htb1-K123R allele after cells were shifted to the media described in panel A. The SUC2 blot was overexposed to show the effect of the htb1-K123R mutation on residual SUC2 mRNA accumulation in the snf5Δ mutant.
Figure 4.
Figure 4.
H2B is transiently ubiquitylated at the PHO5 core promoter. ChDIP was carried out in strains YKH045 (Flag-HTB1) and YKH046 (Flag-htb1-K123R) during growth in YPD medium and at 30-min intervals after a shift to a medium lacking inorganic phosphate, and extracted DNA was analyzed by quantitative PCR in real time to determine the levels of H2B ubiquitylation at the PHO5 core promoter. The data were normalized to the INT-V IP/Input ratios. The Northern blot inset is from Figure 7A.
Figure 5.
Figure 5.
Distribution of ubiquitylated H2B. (A) ChDIP was sequentially performed with anti-Flag and anti-HA antibodies in strains YKH045 (Flag-HTB1) and YKH046 (Flag-htb1-K123R) after growth in YPD medium. PCR in real time was used to measure the level of H2B ubiquitylation at two transcriptionally silenced regions (TELVI-R and HMRa), two ORF-free intergenic regions (INT-V and INT-XVI), the core promoters of two highly transcribed constitutive genes (PMA1 and ACT1), and the core promoters of the GAL1 and PHO5 genes after induction with galactose or no phosphate, respectively. (B) ChIP was performed with anti-HA antibodies in strains YKH010 (Rad6-HA HTB1) and JR5-2A (No tag HTB1) grown in YPD or induced with galactose, and PCR in real time was used to measure the level of Rad6-HA at the genomic regions described in panel A.
Figure 5.
Figure 5.
Distribution of ubiquitylated H2B. (A) ChDIP was sequentially performed with anti-Flag and anti-HA antibodies in strains YKH045 (Flag-HTB1) and YKH046 (Flag-htb1-K123R) after growth in YPD medium. PCR in real time was used to measure the level of H2B ubiquitylation at two transcriptionally silenced regions (TELVI-R and HMRa), two ORF-free intergenic regions (INT-V and INT-XVI), the core promoters of two highly transcribed constitutive genes (PMA1 and ACT1), and the core promoters of the GAL1 and PHO5 genes after induction with galactose or no phosphate, respectively. (B) ChIP was performed with anti-HA antibodies in strains YKH010 (Rad6-HA HTB1) and JR5-2A (No tag HTB1) grown in YPD or induced with galactose, and PCR in real time was used to measure the level of Rad6-HA at the genomic regions described in panel A.
Figure 6.
Figure 6.
Ubiquitylated H2B and Rad6 are associated with the GAL1 promoter and ORF. (A) ChDIP was performed in the Flag-HTB1 strain YKH045 during growth in YPD medium (repressed, white bars) and after galactose induction (induced, gray bars). ChDIP was also performed in the Flag-htb1-K123R strain YKH046 after galactose induction (htb1-K123R, dark gray bars). DNA was analyzed at the GAL1 TATA, 5′ ORF, and 3′ ORF regions by PCR in real time. The INT-V sequences served as a control for media differences. (B) ChIP was performed in the Rad6-HA strain YKH010 during growth in YPD medium (repressed, white bars) and after galactose induction (induced, gray bars). ChIP was also performed in the untagged control strain JR5-2A after galactose induction (No tag, dark gray bar). DNA was analyzed by PCR in real time at the GAL1 UAS and the GAL1 regions described in panel A. The approximate location of primers used for PCR analysis is shown relative to GAL1 promoter regulatory elements and ORF.

Similar articles

Cited by

References

    1. Barbaric S., Reinke, H., and Horz, W. 2003. Multiple mechanistically distinct functions of SAGA at the PHO5 promoter. Mol. Cell. Biol. 23: 3468-3476. - PMC - PubMed
    1. Barsoum J. and Varshavsky, A. 1985. Preferential localization of varient nucleosomes near the 5′ end of the mouse dihydrofolate reductase gene. J. Biol. Chem. 260: 7688-7697. - PubMed
    1. Belotserkovskaya R. and Berger, S.L. 1999. Interplay between chromatin modifying and remodeling complexes in transcriptional regulation. Crit. Rev. Eukaryot. Gene Expr. 9: 221-230. - PubMed
    1. Bernstein B.E., Humphrey, E.L., Erlich, R.L., Schneider, R., Bouman, P., Liu, J.S., Kouzarides, T., and Schreiber, S.L. 2002. Methylation of histone H3 Lys 4 in coding regions of active genes. Proc. Natl. Acad. Sci. 99: 8695-8700. - PMC - PubMed
    1. Bhaumik S.R. and Green, M.R. 2001. SAGA is an essential in vivo target of the yeast acidic activator Gal4p. Genes & Dev. 15: 1935-1945. - PMC - PubMed

Publication types

MeSH terms