

Genetic determinants of obesity-related lipid traits
- PMID: 14754912
- PMCID: PMC2771634
- DOI: 10.1194/jlr.M300474-JLR200
Genetic determinants of obesity-related lipid traits
Abstract
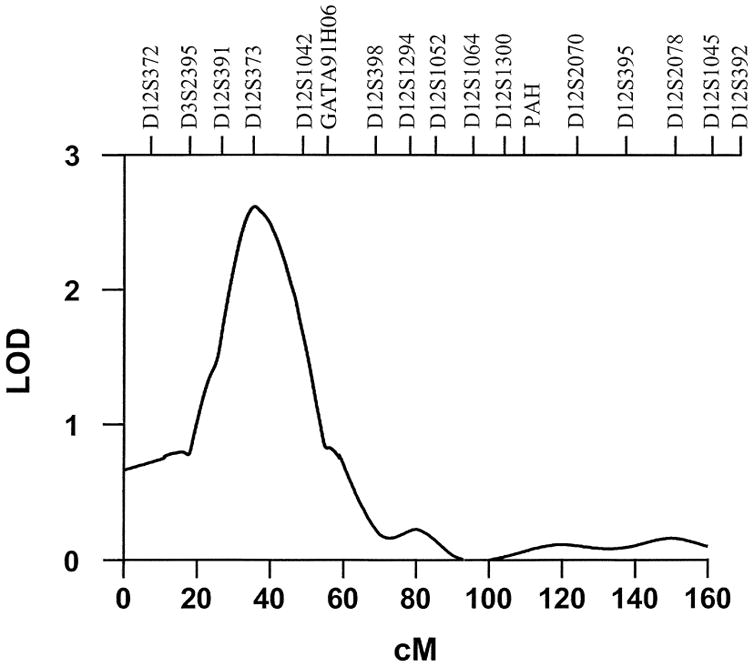
In our ongoing effort to identify genes influencing the biological pathways that underlie the metabolic disturbances associated with obesity, we performed genome-wide scanning in 2,209 individuals distributed over 507 Caucasian families to localize quantitative trait loci (QTLs), which affect variation of plasma lipids. Pedigree-based analysis using a quantitative trait variance component linkage method that localized a QTL on chromosome 7q35-q36, which linked to variation in levels of plasma triglyceride [TG, logarithm of odds (LOD) score = 3.7] and was suggestive of linkage to LDL-cholesterol (LDL-C, LOD = 2.2). Covariates of the TG linkage included waist circumference, fasting insulin, and insulin:glucose, but not body mass index or hip circumference. Plasma HDL-cholesterol (HDL-C) levels were suggestively linked to a second QTL on chromosome 12p12.3 (LOD = 2.6). Five other QTLs with lower LOD scores were identified for plasma levels of LDL-C, HDL-C, and total cholesterol. These newly identified loci likely harbor genetic elements that influence traits underlying lipid adversities associated with obesity.
Figures

Similar articles
-
Multiple QTLs influencing triglyceride and HDL and total cholesterol levels identified in families with atherogenic dyslipidemia.J Lipid Res. 2005 Oct;46(10):2202-13. doi: 10.1194/jlr.M500137-JLR200. Epub 2005 Aug 1. J Lipid Res. 2005. PMID: 16061952
-
Identification of quantitative trait loci that regulate obesity and serum lipid levels in MRL/MpJ x SJL/J inbred mice.J Lipid Res. 2006 Jan;47(1):123-33. doi: 10.1194/jlr.M500295-JLR200. Epub 2005 Oct 27. J Lipid Res. 2006. PMID: 16254318
-
Genome-wide scan on plasma triglyceride and high density lipoprotein cholesterol levels, accounting for the effects of correlated quantitative phenotypes.BMC Genet. 2003 Dec 31;4 Suppl 1(Suppl 1):S47. doi: 10.1186/1471-2156-4-S1-S47. BMC Genet. 2003. PMID: 14975115 Free PMC article.
-
Genome-wide scan identifies novel QTLs for cholesterol and LDL levels in F2[Dahl RxS]-intercross rats.Circ Res. 2004 Mar 5;94(4):446-52. doi: 10.1161/01.RES.0000117770.03168.E7. Epub 2004 Jan 22. Circ Res. 2004. PMID: 14739155
-
Genome-wide linkage scan reveals multiple susceptibility loci influencing lipid and lipoprotein levels in the Quebec Family Study.J Lipid Res. 2004 Mar;45(3):419-26. doi: 10.1194/jlr.M300401-JLR200. Epub 2003 Dec 16. J Lipid Res. 2004. PMID: 14679165
Cited by
-
A comprehensive analysis of adiponectin QTLs using SNP association, SNP cis-effects on peripheral blood gene expression and gene expression correlation identified novel metabolic syndrome (MetS) genes with potential role in carcinogenesis and systemic inflammation.BMC Med Genomics. 2013 Apr 29;6:14. doi: 10.1186/1755-8794-6-14. BMC Med Genomics. 2013. PMID: 23628382 Free PMC article.
-
Accounting for a quantitative trait locus for plasma triglyceride levels: utilization of variants in multiple genes.PLoS One. 2012;7(4):e34614. doi: 10.1371/journal.pone.0034614. Epub 2012 Apr 2. PLoS One. 2012. PMID: 22485179 Free PMC article.
-
Genome-wide linkage analysis of population variation in high-density lipoprotein cholesterol.Hum Genet. 2006 Jun;119(5):541-6. doi: 10.1007/s00439-006-0167-4. Epub 2006 Mar 29. Hum Genet. 2006. PMID: 16570200
-
A novel method, the Variant Impact On Linkage Effect Test (VIOLET), leads to improved identification of causal variants in linkage regions.Eur J Hum Genet. 2014 Feb;22(2):243-7. doi: 10.1038/ejhg.2013.120. Epub 2013 Jun 5. Eur J Hum Genet. 2014. PMID: 23736220 Free PMC article.
-
Serotonin (5-HT) receptor 5A sequence variants affect human plasma triglyceride levels.Physiol Genomics. 2010 Jul 7;42(2):168-76. doi: 10.1152/physiolgenomics.00038.2010. Epub 2010 Apr 13. Physiol Genomics. 2010. PMID: 20388841 Free PMC article.
References
-
- Kissebah AH, Krakower GR. Regional adiposity and morbidity. Physiol Rev. 1994;74:761–811. - PubMed
-
- Lemieux S, Després JP. Metabolic complications of visceral obesity: contribution to the aetiology of type 2 diabetes and implications for prevention and treatment. Diabetes Metab. 1994;20:375–393. - PubMed
-
- Kissebah AH, Peiris AN. Biology of regional body fat distribution: relationship to non-insulin dependent diabetes mellitus. Diab Metab Rev. 1989;5:83–109. - PubMed
-
- Björntorp P. Portal adipose tissue as a generator of risk factors for cardiovascular disease and diabetes. Arteriosclerosis. 1990;10:493–496. - PubMed
-
- Bergman RN, Van Citters GW, Mittelman SD, Dea MK, Hamilton-Wessler M, Kim SP, Ellmerer M. Central role of the adipocyte in the metabolic syndrome. J Investig Med. 2001;49:119–126. - PubMed
Publication types
MeSH terms
Substances
Grants and funding
LinkOut - more resources
Full Text Sources
Medical
Miscellaneous
