. 2004 Apr 15;556(Pt 2):585-99.
doi: 10.1113/jphysiol.2003.059055. Epub 2004 Jan 30.

Propagation of pacemaker activity in the guinea-pig antrum

Affiliations

Propagation of pacemaker activity in the guinea-pig antrum

G W Hennig et al. J Physiol. .

Abstract

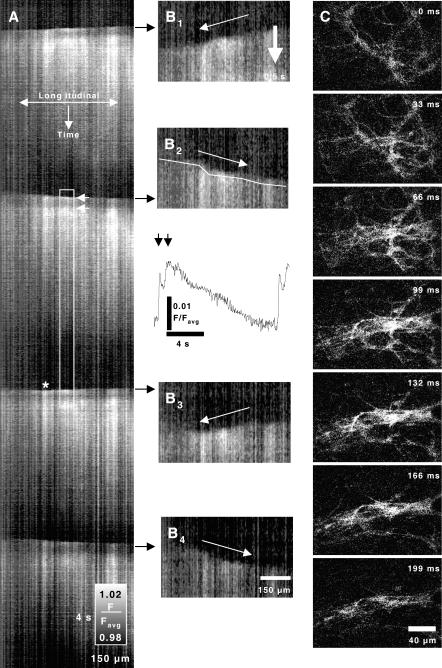
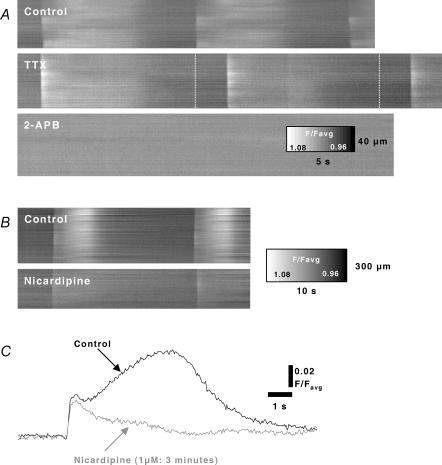
Cyclical periods of depolarization (slow waves) underlie peristaltic contractions involved in mixing and emptying of contents in the gastric antrum. Slow waves originate from a myenteric network of interstitial cells of Cajal (ICC-MY). In this study we have visualized the sequence and propagation of Ca(2+) transients associated with pacemaker potentials in the ICC network and longitudinal (LM) and circular muscle (CM) layers of the isolated guinea-pig gastric antrum. Gastric antrum was dissected to reveal the ICC-MY network, loaded with Fluo-4 AM and activity was monitored at 37 degrees C. Ca(2+) waves propagated throughout the ICC-MY network at an average velocity of 3.24 +/- 0.12 mm s(-1) at a frequency of 4.87 +/- 0.16 cycles min(-1) (n= 4). The propagation of the Ca(2+) wave often appeared 'step-like', with separate regions of the network being activated after variable delays. The direction of propagation was highly variable (Delta angle of propagation 44.3 +/- 10.9 deg per cycle) and was not confined to the axes of the longitudinal or circular muscle. Ca(2+) waves appeared to spread out radially from the site of initiation. The initiating Ca(2+) wave in ICC-MY was correlated to secondary Ca(2+) waves in intramuscular interstitial cells of Cajal, ICC-IM, and smooth muscle cells, and the local distortion (contraction) in a field of view. TTX (1 microm) had little effect on slow wave or pacemaker potential activity, but 2-APB (50 microm) blocked all Ca(2+) waves, indicating a pivotal role for intracellular Ca(2+) stores. Nicardipine (2 microm) eliminated the Ca(2+) transient generated by smooth muscle, but did not affect the fast upstroke associated with ICC-MY. These results indicate that slow waves follow a sequence of activation, beginning with the ICC-MY and ICC-IM network, followed later by a sustained Ca(2+) transient in the muscle layers that is responsible for contraction.


Figures

Figure 1
Figure 1. ICC networks loaded with Fluo-4 in the gastric antrum
A, ICC-MY networks were labelled with Kit antibody. ICC-MY (arrows) are multibranching cells that are organized into a network. B, ICC-IM (arrows) in the circular muscle layers were also labelled by Kit antibodies. C, ICC were loaded with Fluo-4 and underwent fluorescence oscillations at the frequency of slow wave activity. D, Kit immunofluorescence confirmed that cells undergoing changes in Ca2+ fluorescence (Fluo-4 in C) were ICC (compare arrowheads). E shows a Ca2+ transient cycle at 300 ms intervals in individual ICC loaded with Fluo-4. Active cells are outlined in the panels. F, Ca2+ oscillations in the ICC outlined in E. In some cells spontaneous small transients occurred during the interval between slow waves (*).
Figure 2
Figure 2. Variability in direction of propagation of slow waves
The direction of propagation of Ca2+ waves in the ICC-MY network varied from event to event, with subsequent waves often reversing direction. A shows a spatio-temporal map (distance and time as noted) of four Ca2+ waves through a network of ICC-MY and the underlying smooth muscle cells. Each wave front consisted of a sharp increase in fluorescence, followed by a partial decrerase and then a sustained increase in fluorecence. This shows up in the spatio-temporal maps as a distinct band along the top of each wave front (see upper white arrow). B shows close ups of the leading edges of the Ca2+ waves. Arrows denote direction of propagation of each wave. The intensity of the propagating wave was not uniform and varied in different regions (see asterisk in A). Similarly, the velocity of propagation showed variation, with periods of retardation or accelaration visualized as ‘steps’ on the wavefront (white line B2). Trace in the inset under B2 shows average relative fluorescence during a single wave at the time noted by the white rectangle in A. Two distinct peaks were noted (arrows). At higher magnification, it was possible to distinctly visualize the ICC-MY network, but at this level of resolution, it became more difficult to detect the direction or velocity of propagation (C). In some regions, such as around ganglia, different layers of the network activated asynchronously, suggesting multiple propagation pathways can emerge as the pacemaker activity spreads.
Figure 3
Figure 3. Method to determine direction of propagation
At low magnification the propagation of Ca2+ waves in ICC-MY networks was difficult to visualize due to the faint signals (A shows a sequence of images depicting the passage of a waves at × 10; image reversed such that black represents an increase in fluorescence). Radial averaging was used to determine the angle at which the Ca2+ wave front was parallel to the line of averaging (B shows spatio-temporal maps calculated every 45 deg spanning 180 deg), allowing calculation of velocity and direction of propagation (perpendicular to wavefront angle) to be ascertained. When averaging occurred in parallel to the wave front, the average intensity was much higher than at any other angle (C), resulting in a higher proportion of brighter pixels when plotted as a frequency histogram (D). The wave fronts often appeared to be curved, demonstrated by discrete bright areas where the angle of averaging was parallel to the wavefront whilst neightbouring areas were not parallel.
Figure 4
Figure 4. Origin and propagation of Ca2+ waves in an ICC-MY network
A–D show the progression of four sequential Ca2+ waves. In A a wave emerges from the lower edge (0 ms) and propages toward the top of the images within 330 ms. In B–D a site of origin occurred within the field of view. Waves emerged in three successive cycles in the upper right quandrant (below and to the left of the asterisk). In B the emergent pacemaker event collided with a wave coming from the previous dominant site and was anihilated in the right upper quandrant in subsequent images. The previously utilized pathway along the left side of the field of view was preserved. In C–D the pacemaker in the upper right quandrant became regionally dominant and waves propagated radially toward the bottom left corner for 2 cycles. Coloured topological representations were constructed by applying a median filter to each thresholded frame, then regions of high fluorescence were manually outlined and colour-coded to denote the sequence of activation (from time of origin (red) to termination (purple; see colour key)). Active regions from each frame were stacked as a single image and arrows show the overall direction of spread of activity.
Figure 5
Figure 5. Spatial resolution of ICC-MY during propagation of Ca2+ wave
At low magnification it was impossible to discern the morphology of individual ICC-MY (Figs 3 and 4). To be certain that the Ca2+ waves observed occurred in cellular elements of the ICC-MY network, waves were also recorded at × 60 magnification. A shows the progression of a single Ca2+ wave through the ICC-MY network, and the structure of cells is clearly visualized. In the cycle shown in the series of images (0–250 ms), a wave begins at the top right corner and spreads toward the bottom left corner within 50 ms. Fluorescence is sustained in these cells through the rest of the image sequence shown. It should be noted that another region of the network (region 2 in B) is activated with some delay from the main group of cells (region 1 in B) during this Ca2+ wave. C shows fluorecence in regions 1 and 2 as a function of time. Arrows at the bottom depict the time at which the 2 regions became active.
Figure 6
Figure 6. Time course of Ca2+ transients in different cells types
Ca2+ transients with different wave forms were detected in different cell types. A shows a field of view in which a number of cell types were observed. Specific cellular profiles within the areas outlined were used to determine fluorescence changes in different cellular types. B shows typical transients obtained from ICC-MY. These events consisted of a rapid upstroke of fluorescence followed by decay back toward the resting level. C shows events recorded from cells with the morphology of ICC-IM and these events consisted of an echo of the ICC-MY activity (a rapid upstroke and decay toward resting levels) that were always of smaller in amplitude than the events in ICC-MY. ICC-IM had repetitive Ca2+ transients superimposed upon a plateau level. D shows the Ca2+ wave in an adjacent bundle of circular smooth muscle cells (CM). These cells did not display rapid upstrokes in fluorescence but rather a gradual rise and an extended plateau phase before the resting level was restored. E shows Ca2+ fluorescence in a field of view with multiple types of cells. The apparent depression in fluorescence during the interval between transients was a movement artifact. F shows the change in surface area (or distortion) of the field of view resulting from muscle contraction. Note that the smooth muscle Ca2+ wave follows the initiation of activity by ICC-MY, and contraction lags behind the development of the Ca2+ transient in the CM.
Figure 7
Figure 7. Initiating and secondary Ca2+ waves in ICC-IM and CM during the pacemaker cycle
Ca2+ waves were often followed by slowly propagating, localized secondary intracellular Ca2+ waves in cells with the morphology of ICC-IM. These events were confined to individual cells and propagated at a velocity of approximately 60 μm s−1. A shows a field of view in which several ICC-IM-like cells (1–8) and CM cells were visualized. B, events in these cells showed up in spatial temporal maps as flashes following an initial Ca2+ wave front (indicated by arrows). C shows a higher power image of an ICC-IM (region 1) and CM cell (region 2). D shows spatio-temporal map of the activty of the cells in C. Leading edges of initiating Ca2+ waves are indicated by black arrows and secondary intracellular Ca2+ waves, occurring after the initial Ca2+ wave, appear as bright bands. The secondary Ca2+ waves were apparent only during the period of elevated Ca2+ following the initiating Ca2+ wave. The propagation of secondary intracellular Ca2+ varied in frequency and direction (D; region 1). E shows fluorescence traces of region 1 (ICC-1M) and region 2 (CM) during 3 cycles (between white arrows). Note secondary intracellular Ca2+ waves appear as fluorescence peaks in region 1 (ICC-IM).
Figure 8
Figure 8. Pharmacology of Ca2+ waves
Spatio-temporal maps display Ca2+ waves in fields of view (i.e. representing contributions from ICC and CM) before and after TTX (1 μm). TTX did not abolish generation or propagation of Ca2+ waves, however, an increase was noted in the period between Ca2+ waves (white dashed lines indicate normal period). 2-APB (25 μm) abolished Ca2+ waves. B, nicardipine (2 μm) reduced the sustained elevation in Ca2+ (attibuted to CM as in Fig. 6D) following the initiating Ca2+ wave. C, the initial rapid rise in Ca2+ fluorescence (attributed to the contribution of ICC-MY as in Figs 1 and 6B) was well maintained in the presence of nicardipine.

References

    1. Bauer AJ, Publicover NG, Sanders KM. Origin and spread of slow waves in canine gastric antral circular muscle. Am J Physiol. 1985;249:G800–G806. - PubMed
    1. Burns AJ, Herbert TM, Ward SM, Sanders KM. Interstitial cells of Cajal in the guinea-pig gastrointestinal tract as revealed by c-Kit immunohistochemistry. Cell Tissue Res. 1997;290:11–20. - PubMed
    1. Burns AJ, Lomax AE, Torihashi S, Sanders KM, Wards SM. Interstitial cells of Cajal mediate inhibitory neurotransmission in the stomach. Proc Nat Acad Sci U S A. 1996;93:12008–12013. - PMC - PubMed
    1. Cousins HM, Edwards FR, Hickey H, Hill CE, Hirst GDS. Electrical coupling between myenteric interstitial cells of Cajal and adjacent muscle layers in the guinea pig gastric antrum. J Physiol. 2003;550:829–844. - PMC - PubMed
    1. Dickens EJ, Edwards FR, Hirst GDS. Vagal inhibitory projections to rhythmically active cells in the antral region of guinea-pig stomach. Am J Physiol. 2000;279:G388–G399. - PubMed

Publication types

LinkOut - more resources