

Spatiotemporal patterning of IP3-mediated Ca2+ signals in Xenopus oocytes by Ca2+-binding proteins
- PMID: 14755000
- PMCID: PMC1664953
- DOI: 10.1113/jphysiol.2003.059204
Spatiotemporal patterning of IP3-mediated Ca2+ signals in Xenopus oocytes by Ca2+-binding proteins
Abstract
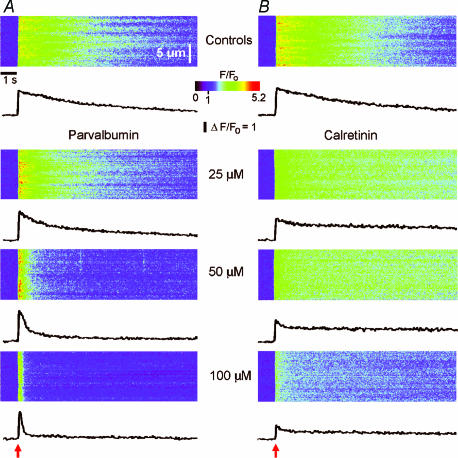
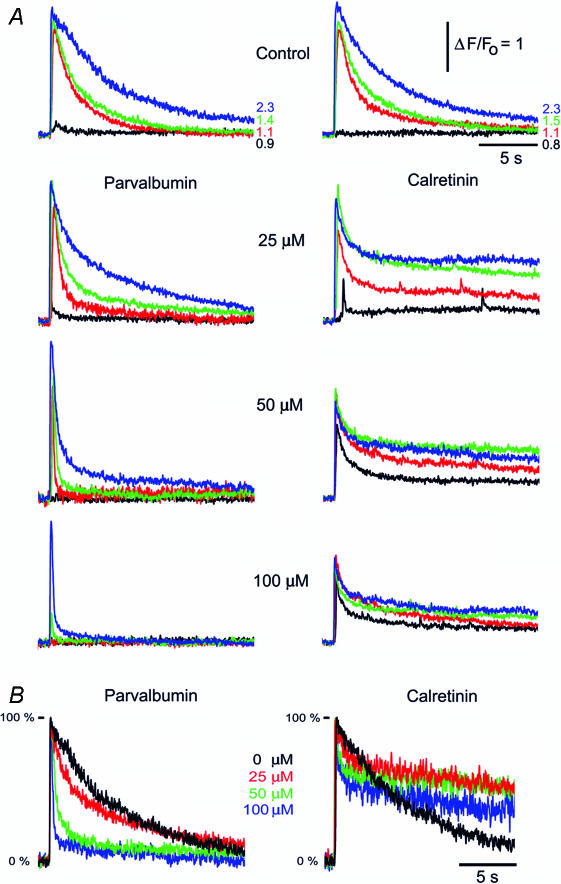
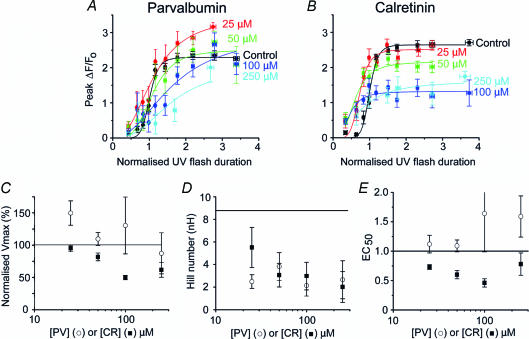
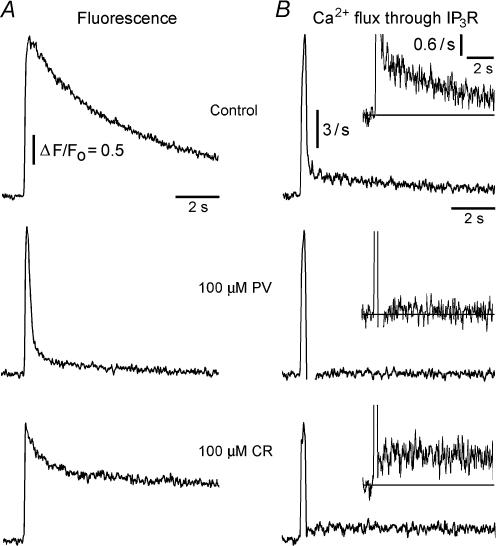
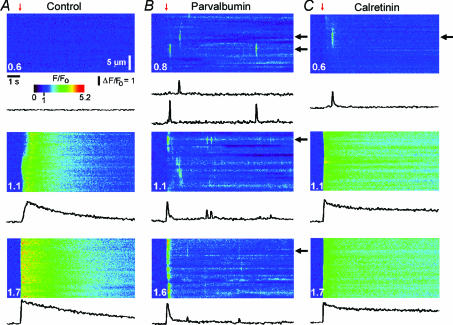
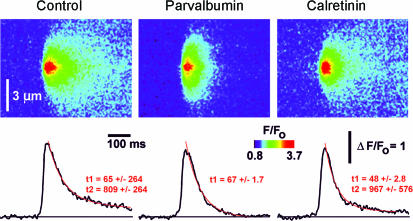
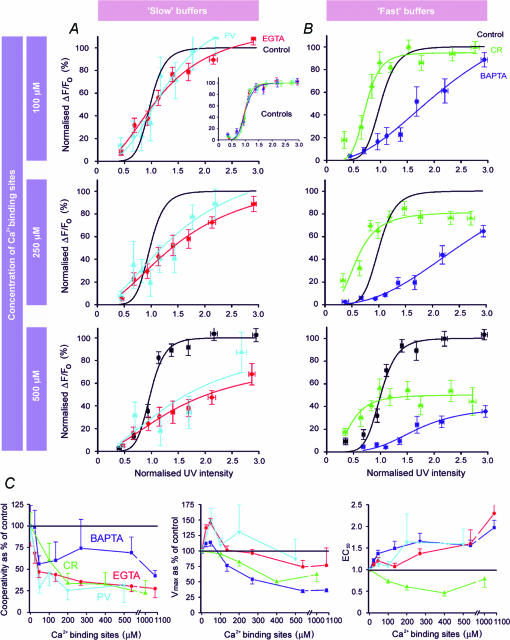
Ca(2+)-binding proteins (CaBPs) are expressed in a highly specific manner across many different cell types, yet the physiological basis underlying their selective distribution patterns remains unclear. We used confocal line-scan microscopy together with photo-release of IP(3) in Xenopus oocytes to investigate the actions of mobile cytosolic CaBPs on the spatiotemporal properties of IP(3)-evoked Ca(2+) signals. Parvalbumin (PV), a CaBP with slow Ca(2+)-binding kinetics, shortened the duration of IP(3)-evoked Ca(2+) signals and 'balkanized' global responses into discrete localized events (puffs). In contrast, calretinin (CR), a presumed fast buffer, prolonged Ca(2+) responses and promoted 'globalization' of spatially uniform Ca(2+) signals at high [IP(3)]. Oocytes loaded with CR or PV showed Ca(2+) puffs following photolysis flashes that were subthreshold in controls, and the spatiotemporal properties of these localized events were differentially modulated by PV and CR. In comparison to results we previously obtained with exogenous Ca(2+) buffers, PV closely mimicked the actions of the slow buffer EGTA, whereas CR showed important differences from the fast buffer BAPTA. Most notably, puffs were never observed after loading BAPTA, and this exogenous buffer did not show the marked sensitization of IP(3) action evident with CR. The ability of Ca(2+) buffers and CaBPs with differing kinetics to fine-tune both global and local intracellular Ca(2+) signals is likely to have significant physiological implications.
Figures
Similar articles
-
Buffer kinetics shape the spatiotemporal patterns of IP3-evoked Ca2+ signals.J Physiol. 2003 Dec 15;553(Pt 3):775-88. doi: 10.1113/jphysiol.2003.054247. Epub 2003 Oct 10. J Physiol. 2003. PMID: 14555715 Free PMC article.
-
Control of IP(3)-mediated Ca2+ puffs in Xenopus laevis oocytes by the Ca2+-binding protein parvalbumin.J Physiol. 2001 Aug 15;535(Pt 1):3-16. doi: 10.1111/j.1469-7793.2001.t01-2-00003.x. J Physiol. 2001. PMID: 11507154 Free PMC article.
-
Phasic characteristic of elementary Ca(2+) release sites underlies quantal responses to IP(3).EMBO J. 2000 Jul 17;19(14):3608-17. doi: 10.1093/emboj/19.14.3608. EMBO J. 2000. PMID: 10899115 Free PMC article.
-
Cytosolic Ca2+ buffers.Cold Spring Harb Perspect Biol. 2010 Nov;2(11):a004051. doi: 10.1101/cshperspect.a004051. Epub 2010 Oct 13. Cold Spring Harb Perspect Biol. 2010. PMID: 20943758 Free PMC article. Review.
-
The use of transgenic mouse models to reveal the functions of Ca2+ buffer proteins in excitable cells.Biochim Biophys Acta. 2012 Aug;1820(8):1294-303. doi: 10.1016/j.bbagen.2011.11.008. Epub 2011 Nov 27. Biochim Biophys Acta. 2012. PMID: 22138448 Review.
Cited by
-
Characterization of calretinin I-II as an EF-hand, Ca2+, H+-sensing domain.Protein Sci. 2005 Jul;14(7):1879-87. doi: 10.1110/ps.051369805. Epub 2005 Jun 3. Protein Sci. 2005. PMID: 15937279 Free PMC article.
-
Noise analysis of cytosolic calcium image data.Cell Calcium. 2020 Mar;86:102152. doi: 10.1016/j.ceca.2019.102152. Epub 2019 Dec 18. Cell Calcium. 2020. PMID: 31918030 Free PMC article.
-
Calretinin regulates Ca2+-dependent inactivation and facilitation of Ca(v)2.1 Ca2+ channels through a direct interaction with the α12.1 subunit.J Biol Chem. 2012 Nov 16;287(47):39766-75. doi: 10.1074/jbc.M112.406363. Epub 2012 Oct 2. J Biol Chem. 2012. PMID: 23033479 Free PMC article.
-
Bidirectional Ca²⁺ signaling occurs between the endoplasmic reticulum and acidic organelles.J Cell Biol. 2013 Mar 18;200(6):789-805. doi: 10.1083/jcb.201204078. Epub 2013 Mar 11. J Cell Biol. 2013. PMID: 23479744 Free PMC article.
-
Visualizing metal ions in cells: an overview of analytical techniques, approaches, and probes.Biochim Biophys Acta. 2012 Sep;1823(9):1406-15. doi: 10.1016/j.bbamcr.2012.04.001. Epub 2012 Apr 13. Biochim Biophys Acta. 2012. PMID: 22521452 Free PMC article. Review.
References
-
- Allbritton NL, Meyer T, Stryer L. Range of messenger action of calcium ion and inositol 1,4,5-trisphosphate. Science. 1992;258:1812–1815. - PubMed
-
- Andressen C, Blumcke I, Celio MR. Calcium-binding proteins: selective markers of nerve cells. Cell Tissue Res. 1993;271:181–208. - PubMed
-
- Baimbridge KG, Celio MR, Rogers JH. Calcium binding proteins in the nervous system. Trends Neurosci. 1992;15:303–308. - PubMed
-
- Berridge MJ, Lipp P, Bootman MD. The versatility and universality of calcium signalling. Nat Rev Mol Cell Biol. 2000;1:11–21. - PubMed
Publication types
MeSH terms
Substances
Grants and funding
LinkOut - more resources
Full Text Sources
Research Materials
Miscellaneous