. 2004 Feb;113(3):414-24.
doi: 10.1172/JCI19511.

Site and mechanism of leptin action in a rodent form of congenital lipodystrophy

Affiliations

Site and mechanism of leptin action in a rodent form of congenital lipodystrophy

Esra Asilmaz et al. J Clin Invest. 2004 Feb.

Abstract

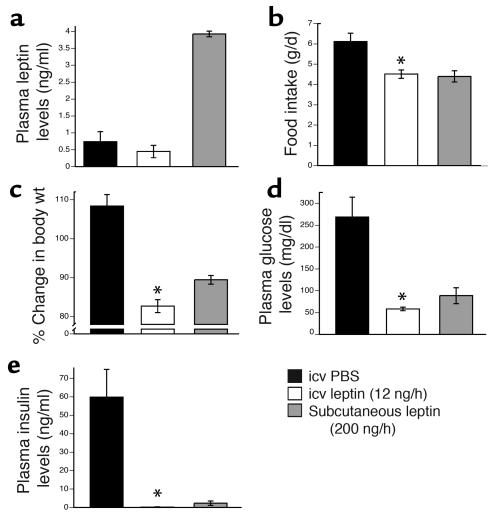
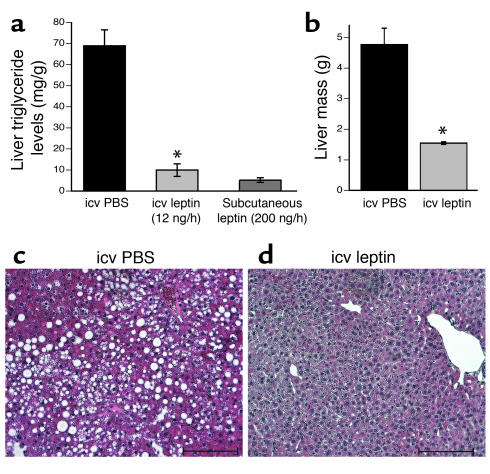
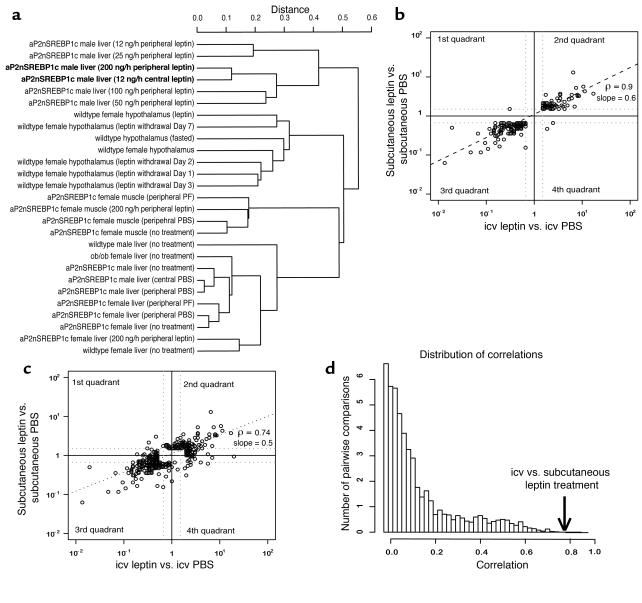
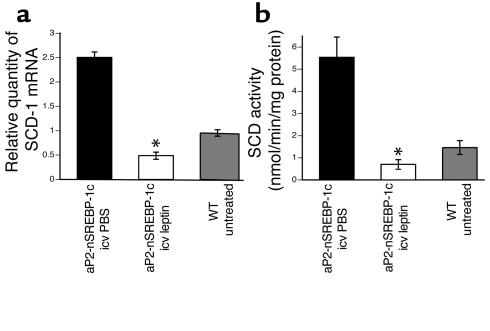
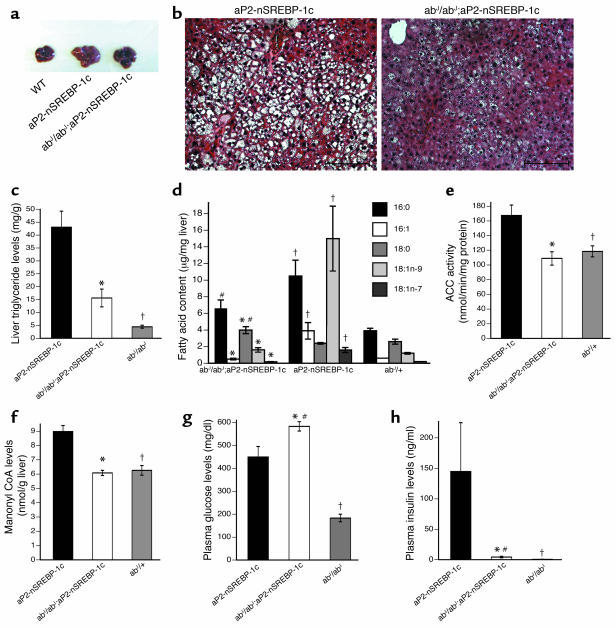
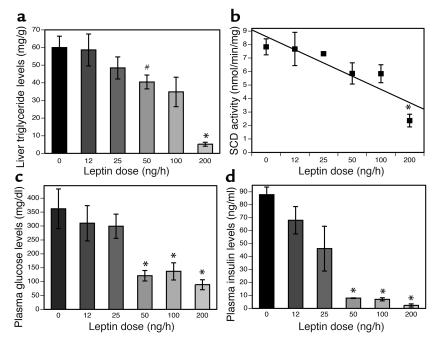
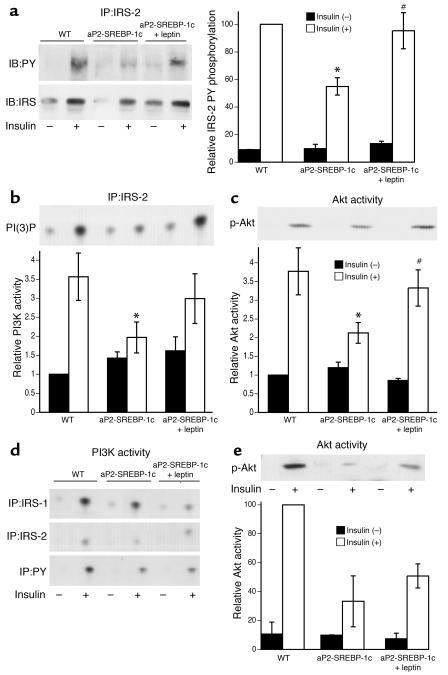
Lipodystrophy is characterized by the complete or partial absence of adipose tissue, insulin resistance, hepatic steatosis, and leptin deficiency. Here, we show that low-dose central leptin corrects the insulin resistance and fatty liver of lipodystrophic aP2-nSREBP-1c mice, while the same dose given peripherally does not. Central leptin also repressed stearoyl-CoA desaturase-1 (SCD-1) RNA and enzymatic activity, which were increased in livers of lipodystrophic mice. aP2-nSREBP-1c mice homozygous for an SCD-1 deletion had markedly reduced hepatic steatosis, increased saturated fatty acids, decreased acetyl-CoA carboxylase activity, and decreased malonyl-CoA levels in the liver. Despite the reduction in hepatic steatosis, these mice remained diabetic. A leptin dose-response curve showed that subcutaneous leptin improved hyperglycemia and hyperinsulinemia in aP2-nSREBP-1c mice at doses that did not substantially alter hepatic steatosis or hepatic SCD enzymatic activity. Leptin treatment at this dose improved insulin-stimulated insulin receptor and insulin receptor substrate 2 (IRS-2) phosphorylation, IRS-2-associated PI3K activity, and Akt activity in liver. Together, these data suggest that CNS-mediated repression of SCD-1 contributes to leptin's antisteatotic actions. Intracerebroventricular leptin improves glucose homeostasis by improving insulin signal transduction in liver, but in this case the effect appears to be independent of SCD-1.


Figures

Figure 1
Figure 1
Effects of central and peripheral leptin in rodent lipodystrophy. Several metabolic parameters in aP2-nSREBP-1c transgenic mice treated with icv PBS, icv leptin (12 ng/h), and subcutaneous leptin (200 ng/h) are shown. (a, d, and e) Plasma levels of leptin, glucose, and insulin, respectively. (b) Average daily food intake for the 12-day treatment. (c) Percentage change in body weight. One hundred percent change indicates the weight of the mice on the day of pump insertion. Error bars indicate the SE for four mice per group for each treatment. *P < 0.05, icv leptin vs. icv PBS.
Figure 2
Figure 2
Correction of fatty liver with central leptin treatment. (a) Liver triglyceride content. (b) Liver mass in grams. Error bars indicate the SE for four mice per group for each treatment. *P < 0.05, icv leptin vs. icv PBS. (c and d) Representative liver sections from mice treated with icv PBS and icv leptin. Original magnification, ×200; scale bars: 100 μm.
Figure 3
Figure 3
Computational analyses of the hepatic transcription profile after icv and subcutaneous leptin treatment. Cluster analysis, correlation analysis, and the distribution of correlations of liver gene expression from mice treated with icv leptin versus icv PBS and subcutaneous leptin versus subcutaneous PBS are shown. (a) Standard hierarchical clustering of 30 microarray experiments, including icv leptin and subcutaneous leptin treatments, show that the transcription profiles of icv and subcutaneous leptin are more similar to each other than to any other sample. (b) A pairwise comparison of icv and subcutaneous leptin gene expression is shown for genes regulated by both treatments (the intersection set). In the first quadrant, gene expression is increased in subcutaneous treatment and decreased in icv treatment; in the second quadrant, gene expression is increased in both treatments; in the third quadrant, gene expression is decreased in both treatments; and in the fourth quadrant, gene expression is decreased in subcutaneous treatment and increased in icv treatment. In almost all cases, gene expression is similarly regulated by both treatments. ρ denotes the correlation value. (c) The logarithm of fold changes of subcutaneous leptin versus PBS and icv leptin versus PBS for genes regulated by either treatment (the union set) is shown. (d) The distribution of correlations of 3,962 pairwise comparisons from our database is shown. The arrow shows the correlation of the icv leptin versus PBS treatment and the subcutaneous leptin versus PBS treatment. This shows that gene expression after icv and subcutaneous leptin is more highly correlated than for the other comparisons (P < 0.002).
Figure 4
Figure 4
Regulation of SCD-1 by icv leptin. SCD-1 mRNA levels and enzyme activity are shown for aP2-nSREBP-1c transgenic mice treated with icv PBS, icv leptin, and WT littermate controls. (a) TaqMan real-time PCR of liver RNA samples using primers and probe specific for SCD-1. (b) Enzymatic activity measured in liver extracts. Error bars indicate the SE; n = 4 for icv PBS and icv leptin, and n = 6 for the WT group. *P < 0.05, icv leptin vs. icv PBS.
Figure 5
Figure 5
Correction of fatty liver but not diabetes in abJ/abJ;aP2-nSREBP-1c transgenic mice. (a) Gross liver appearance in abJ/abJ;aP2-nSREBP-1c transgenic mice, aP2-nSREBP-1c transgenic mice, and WT mice. (b) Representative liver sections from aP2-nSREBP-1c and abJ/abJ;aP2-nSREBP-1c mice. Original magnification, ×200; scale bars: 100 μm. (c) Liver triglyceride levels. (d) Fatty acid content in liver. (e) ACC activity in liver. (f) Malonyl-CoA levels in liver. (g and h) Plasma glucose and plasma insulin levels, respectively. Error bars indicate the SE; n = 7 for the aP2-nSREBP-1c group, n = 6 for the abJ/abJ;aP2-nSREBP-1c group, and n = 3 for the abJ/abJ group. *P < 0.05, abJ/abJ;aP2-nSREBP-1c vs. aP2-nSREBP-1c mice; P < 0.05, aP2-nSREBP-1c vs. abJ/abJ or abJ/+; #P < 0.05 abJ/abJ;aP2-nSREBP-1c vs. abJ/abJ or abJ/+.
Figure 6
Figure 6
Dose-response curve for leptin treatment. Leptin corrects hyperinsulinemia and hyperglycemia at leptin doses that have no effect on SCD activity and gross liver appearance (50 ng/h and 100 ng/h). (a) Liver triglyceride content. (b) SCD enzymatic activity measured in liver extracts of aP2-nSREBP-1c mice treated with several doses of subcutaneous leptin. (c and d) Plasma glucose and plasma insulin levels, respectively. Error bars indicate the SE; n = 3 for 12 ng/h and 25 ng/h leptin, and n = 4 for 0 ng/h, 50 ng/h, 100 ng/h, and 200 ng/h leptin. *P < 0.005, 200-ng/h leptin dose vs. 0-ng/h dose. #P < 0.05, 50-ng/h leptin dose vs. 0-ng/h dose.
Figure 7
Figure 7
Insulin signal transduction after leptin treatment. Subcutaneous leptin leads to an improvement of insulin signaling in liver but not in muscle of aP2-SREBP-1c mice treated with 50 ng/h of subcutaneous leptin. (a) Insulin-induced tyrosine phosphorylation of IRS molecules in liver. (b) PI3K activities associated with tyrosine-phosphorylated proteins in liver. (c) In vitro AKT kinase activity in liver. The upper panels in b and c show representative results of relative immunoblot analysis, and in the lower panels, error bars indicate the SE; n = 4. *P < 0.05, WT vs. aP2-nSREBP-1c; #P < 0.05, aP2-nSREBP-1c vs. aP2-nSREBP-1c plus leptin. (d) PI3K activities associated with tyrosine-phosphorylated proteins in muscle. (e) In vitro AKT kinase activity in muscle. The upper panel shows representative results of immunoblot analysis, and in the lower panel, each bar represents the mean calculated from two independent experiments. IB, immunoblot; IP, immunoprecipitation; PY, phospho tyrosine; PI(3)P, PI(3) phosphate.

References

    1. Zhang Y, et al. Positional cloning of the mouse obese gene and its human homologue. Nature. 1994;372:425–432. - PubMed
    1. Friedman JM. Obesity in the new millennium. Nature. 2000;404:632–634. - PubMed
    1. Chinookoswong N, Wang JL, Shi ZQ. Leptin restores euglycemia and normalizes glucose turnover in insulin-deficient diabetes in the rat. Diabetes. 1999;48:1487–1492. - PubMed
    1. Ogawa Y, et al. Increased glucose metabolism and insulin sensitivity in transgenic skinny mice overexpressing leptin. Diabetes. 1999;48:1822–1829. - PubMed
    1. Kamohara S, Burcelin R, Halaas JL, Friedman JM, Charron MJ. Acute stimulation of glucose metabolism in mice by leptin treatment. Nature. 1997;389:374–377. - PubMed

Publication types