. 2004 Feb;113(3):451-63.
doi: 10.1172/JCI19585.

Autoreactive T cell responses show proinflammatory polarization in diabetes but a regulatory phenotype in health

Affiliations

Autoreactive T cell responses show proinflammatory polarization in diabetes but a regulatory phenotype in health

Sefina Arif et al. J Clin Invest. 2004 Feb.

Abstract

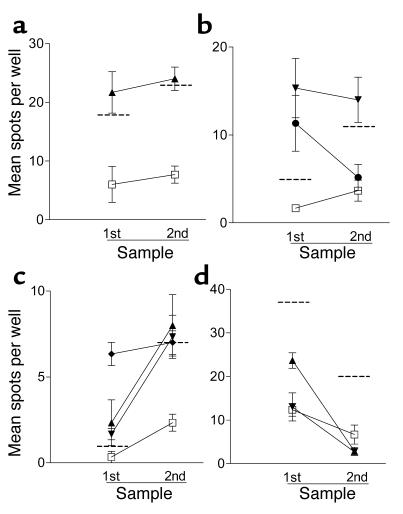
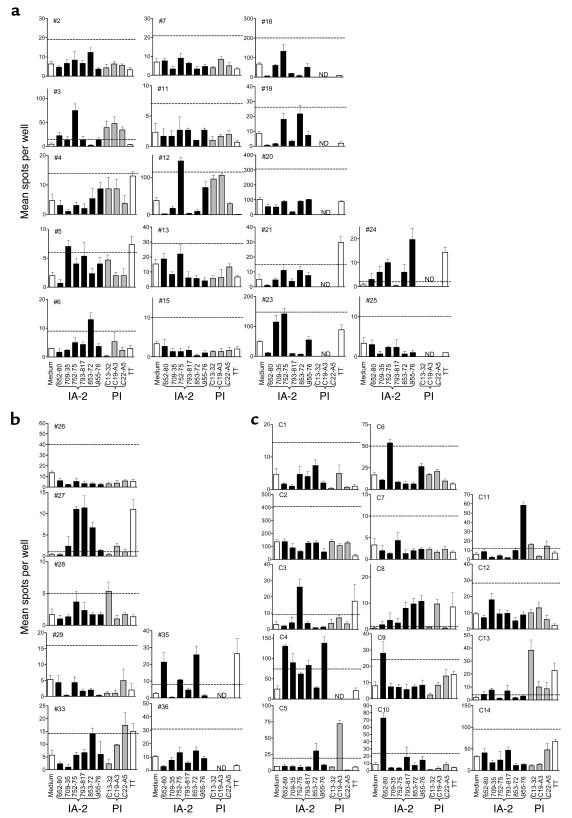
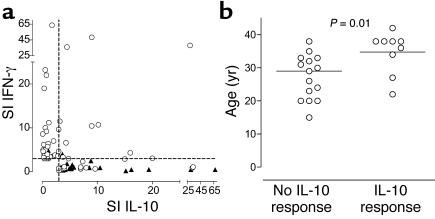
According to the quality of response they mediate, autoreactive T cells recognizing islet beta cell peptides could represent both disease effectors in the development of type 1 diabetes (T1DM) and directors of tolerance in nondiabetic individuals or those undergoing preventative immunotherapy. A combination of the rarity of these cells, inadequate technology, and poorly defined epitopes, however, has hampered examination of this paradigm. We have identified a panel of naturally processed islet epitopes by direct elution from APCs bearing HLA-DR4. Employing these epitopes in a sensitive, novel cytokine enzyme-linked immunosorbent spot assay, we show that the quality of autoreactive T cells in patients with T1DM exhibits extreme polarization toward a proinflammatory Th1 phenotype. Furthermore, we demonstrate that rather than being unresponsive, the majority of nondiabetic, HLA-matched control subjects also manifest a response against islet peptides, but one that shows extreme T regulatory cell (Treg, IL-10-secreting) bias. We conclude that development of T1DM depends on the balance of autoreactive Th1 and Treg cells, which may be open to favorable manipulation by immune intervention.


Figures

Figure 1
Figure 1
Reproducibility of cytokine ELISPOT analyses. (a) Intra-assay variability. The same PBMC preparation has been analyzed 12 times on the same sample plate. IFN-γ spot number per well (300,000 cells) is shown for medium and in the presence of 100 ng/ml tetanus toxoid. The intra-assay coefficient of variation for the 12 repeated analyses is 12.3%. (b) Inter-assay variability. The same donor has been venesected on seven separate occasions. IFN-γ spot number per well (300,000 cells) is shown for medium (black bars) and in the presence of 100 ng/ml tetanus toxoid (white bars) for each time point 1–7, representing (time point 1) November 2002, (time points 2–4) three occasions in August 2003, and (time points 5–7) three occasions in September 2003. The interassay coefficient of variation for the seven repeated analyses is 10.2%.
Figure 2
Figure 2
(a) Determining a cut-off value for assigning positive and negative ELISPOT responses. Graph represents a ROC plot showing assay diagnostic sensitivity (proportion of true positive tests) against specificity (one minus proportion of false positives) following detection of IFN-γ ELISPOT responses to IA-2 and PI peptides in 36 patients with T1DM and 14 nondiabetic control subjects. For each of various possible cut-off values, the sensitivity (proportion of T1DM cases positive) is plotted against one minus specificity representing the proportion of controls that are positive. SIs were calculated as the ratio of the mean response in the presence of peptide to the mean response in the presence of diluent alone. By convention, we selected the cut-off value that provides an operating position nearest to that of the “perfect test” (i.e., closest approximation to 100% sensitivity and 100% specificity), which was SI ≥ 3.0. (bg) Representative cytokine ELISPOT responses. (b) Representative strong IFN-γ response to IA-2 peptide compared with background response to (c) diluent alone in a patient with T1DM; (d) representative moderate IFN-γ response to PI peptide compared with background response to (e) diluent alone in a patient with T1DM; (f) representative IL-10 response to IA-2 peptide compared with background response to (g) diluent alone in a non-diabetic control subject.
Figure 3
Figure 3
IFN-γ ELISPOT analyses in response to medium alone, six IA-2 peptides, three PI peptides, and tetanus toxoid (TT) for each patient with T1DM and each nondiabetic control subject. Each graph shows mean (SEM) of triplicate wells for each analysis on each subject (nos. 1–36 and C1–C14). Horizontal dashed line represents cut-off of positivity (SI ≥ 3.0 when compared with diluent alone). (a) T1DM patients with at least one HLA-DR4 allele. (b) T1DM patients with non-DR4 alleles. (c) Nondiabetic control subjects. See Table 1 for case identifiers, HLA types, and clinical characteristics of the subjects. ND, not done.
Figure 4
Figure 4
Cytokine ELISPOT responses to islet peptides are mediated by CD4 T cells. (a and b) Representative analyses from two T1DM patients positive (SI > 3.0) for IFN-γ responses to the IA-2 peptides 709–735 (triangles), 752–775 (squares), and PI peptide C19-A3 (circles), in which peptides were cultured with entire PBMCs or PBMCs immunomagnetically depleted of CD4 T cells before the ELISPOT analysis. (a) Background (medium alone) responses for the patients were 5.3 ± 1.9 spots per well (mean ± SEM) and (b) 1.3 ± 0.6 spots per well. In both subjects positive responses are reduced to background levels by CD4 depletion.
Figure 5
Figure 5
Persistence of T cell responses. (ad) Blood samples were available from four patients on two occasions 15–23 weeks apart for detection of IFN-γ T cell response using ELISPOT analysis. Shown are mean (± SEM) spots per well for the first and second samples. (ac) Second samples were tested only against selected peptides positive in the first sample. (d) Two peptides for retesting were selected at random. Background (peptide diluent plus media alone) is represented by the open squares, and the dashed horizontal line represents the cut-off for positivity in each assay (SI ≥ 3). (a) The patient responds to IA-2752–775 (triangles) on both occasions. (b) The patient responds to IA-2709–735 (inverted triangles) in both samples, but the response to IA-2853–872 (circles) declines. (c) The patient responds to IA-2752–775, IA-2709–735, and IA-2793–817 (diamonds) on both occasions. (d) The patient shows no response to IA-2709–735 or IA-2752–775 in either sample.
Figure 6
Figure 6
IL-10 ELISPOT analyses in response to medium alone, six IA-2 peptides, three PI peptides, and tetanus toxoid (TT) for patients with T1DM and each nondiabetic control subject. Each graph shows mean (SEM) of triplicate wells for each analysis on each subject (no. 1–36 and C1–C14). Horizontal dashed line represents cut-off of positivity (SI ≥ 3.0 when compared with diluent alone). (a) T1DM patients with at least one HLA-DR4 allele. (b) T1DM patients with non-DR4 alleles. (c) Nondiabetic control subjects. See Table 1 for case identifiers, HLA types, and clinical characteristics of the subjects.
Figure 7
Figure 7
(a) Polarization of autoreactive T cell responses to IA-2 and PI peptides in patients with T1DM (open circles) and nondiabetic control subjects (closed triangles). For any given positive peptide response (SI ≥ 3.0 for IFN-γ or IL-10), the SI for each cytokine has been plotted. There is a highly significant inverse correlation between responses represented by each of these cytokines (P = 0.000004), indicating extreme polarization of proinflammatory and regulatory autoreactivity. Patients with T1DM are clustered close to the y axis, and nondiabetic control subjects are distributed along the x axis, indicating the association of disease and tolerant states with proinflammatory and regulatory responses, respectively. (b) Relationship between age at onset of T1DM and production of IL-10 in response to peptides of IA-2 and PI. Of 24 patients tested, those making IL-10 responses are significantly older (P = 0.01).

Comment in

References

    1. Atkinson MA, Eisenbarth GS. Type 1 diabetes: new perspectives on disease pathogenesis and treatment. Lancet. 2001;358:221–229. - PubMed
    1. Raz I, et al. Beta-cell function in new-onset type 1 diabetes and immunomodulation with a heat-shock protein peptide (DiaPep277): a randomised, double-blind, phase II trial. Lancet. 2001;358:1749–1753. - PubMed
    1. Schatz DA, Bingley PJ. Update on major trials for the prevention of type 1 diabetes mellitus: the American Diabetes Prevention Trial (DPT-1) and the European Nicotinamide Diabetes Intervention Trial (ENDIT) J. Pediatr. Endocrinol. Metab. 2001;14(Suppl 1):619–622. - PubMed
    1. Diabetes Prevention Trial—Type 1 Diabetes Study Group. Effects of insulin in relatives of patients with type 1 diabetes mellitus. N. Engl. J. Med. 2002;346:1685–1691. - PubMed
    1. Herold KC, et al. Anti-CD3 monoclonal antibody in new-onset type 1 diabetes mellitus. N. Engl. J. Med. 2002;346:1692–1698. - PubMed

Publication types