

Investigation of fiber-optic probe designs for optical spectroscopic diagnosis of epithelial pre-cancers
- PMID: 14755422
- PMCID: PMC2768119
- DOI: 10.1002/lsm.10239
Investigation of fiber-optic probe designs for optical spectroscopic diagnosis of epithelial pre-cancers
Abstract
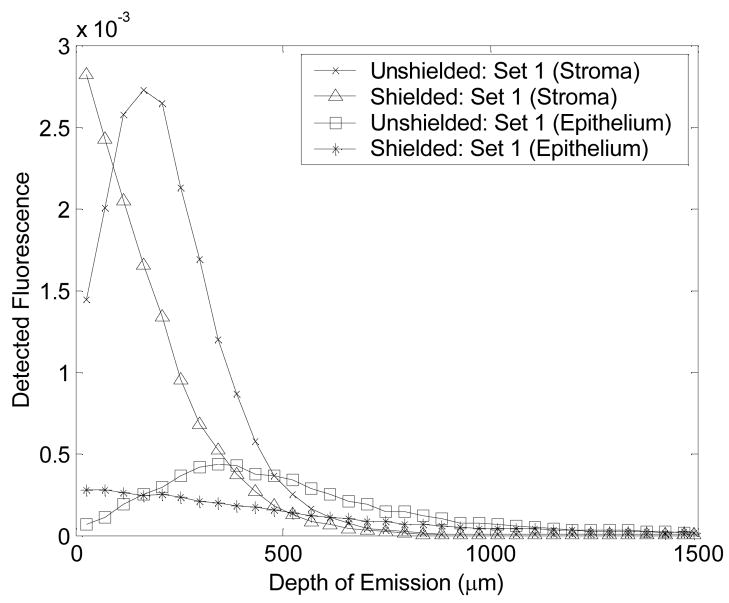
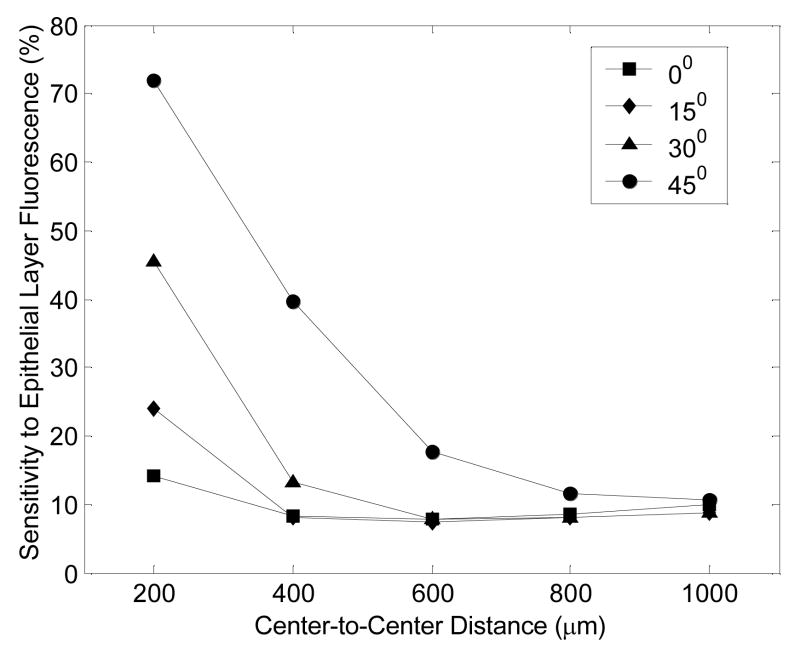
Background and objectives: The first objective of this study was to evaluate the performance of fluorescence spectroscopy for diagnosing pre-cancers in stratified squamous epithelial tissues in vivo using two different probe geometries with (1) overlapping versus (2) non-overlapping illumination and collection areas on the tissue surface. Probe (1) and probe (2) are preferentially sensitive to the fluorescence originating from the tissue surface and sub-surface tissue depths, respectively. The second objective was to design a novel, angled illumination fiber-optic probe to maximally exploit the depth-dependent fluorescence properties of epithelial tissues.
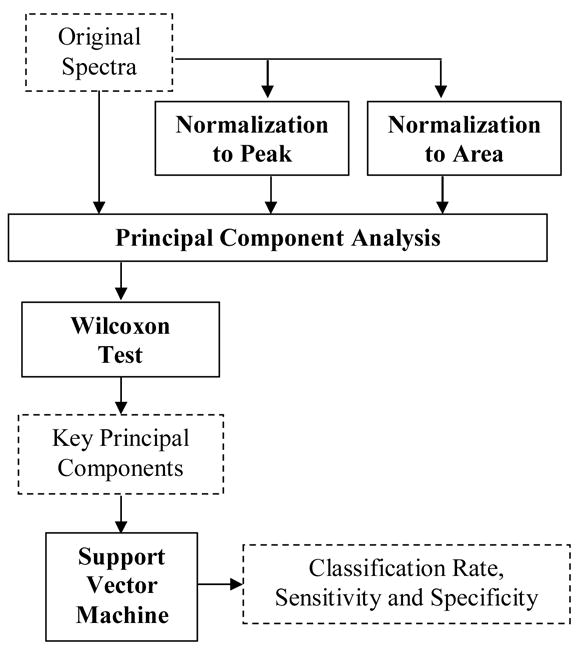
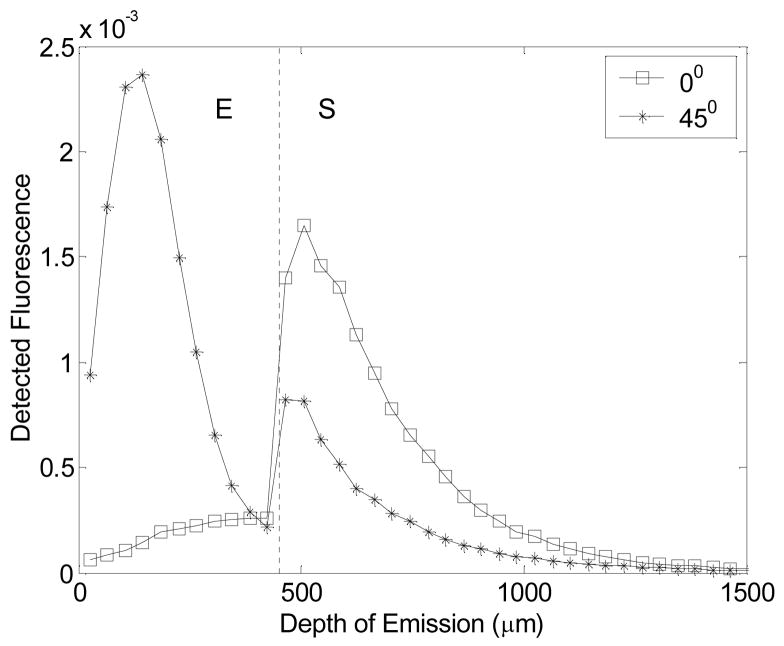
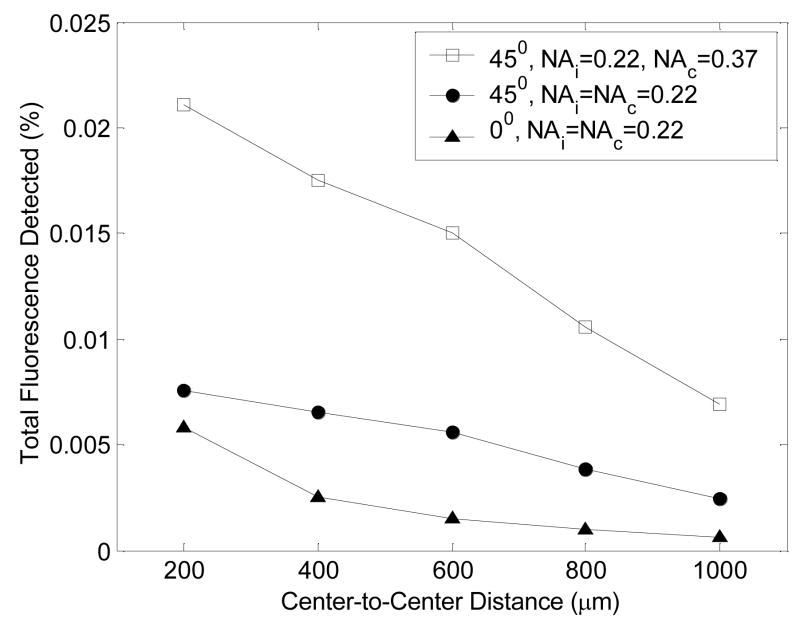
Study design/materials and methods: In the first study, spectra were measured from epithelial pre-cancers and normal tissues in the hamster cheek pouch and analyzed with a non-parametric classification algorithm. In the second study, Monte Carlo modeling was used to simulate fluorescence measurements from an epithelial tissue model with the angled illumination probe.
Results: An unbiased classification algorithm based on spectra measured with probes (1) and (2), classified pre-cancerous and normal tissues with 78 and 94% accuracy, respectively. The angled illumination probe design provides the capability to detect fluorescence from a wide range of tissue depths in an epithelial tissue model.
Conclusions: The first study demonstrates that fluorescence originating from sub-surface tissue depths (probe (2)) is more diagnostic than fluorescence originating from the tissue surface (probe (1)) in the hamster cheek pouch model. However in general, it is difficult to know a priori the optimal probe geometry for pre-cancer detection in a particular epithelial tissue model. The angled illumination probe provides the capability to measure tissue fluorescence selectively from different depths within epithelial tissues, thus obviating the need to select a single optimal probe design for the fluorescence-based diagnosis of epithelial pre-cancers.
Copyright 2004 Wiley-Liss, Inc.
Figures
Similar articles
-
Effect of fiber optic probe geometry on depth-resolved fluorescence measurements from epithelial tissues: a Monte Carlo simulation.J Biomed Opt. 2003 Apr;8(2):237-47. doi: 10.1117/1.1559058. J Biomed Opt. 2003. PMID: 12683849
-
Autofluorescence spectroscopy for in vivo diagnosis of DMBA-induced hamster buccal pouch pre-cancers and cancers.J Oral Pathol Med. 2003 Jan;32(1):18-24. doi: 10.1034/j.1600-0714.2003.00049.x. J Oral Pathol Med. 2003. PMID: 12558954
-
Experimental proof of the feasibility of using an angled fiber-optic probe for depth-sensitive fluorescence spectroscopy of turbid media.Opt Lett. 2004 Sep 1;29(17):2034-6. doi: 10.1364/ol.29.002034. Opt Lett. 2004. PMID: 15455771
-
Beveled fiber-optic probe couples a ball lens for improving depth-resolved fluorescence measurements of layered tissue: Monte Carlo simulations.Phys Med Biol. 2008 Feb 21;53(4):937-51. doi: 10.1088/0031-9155/53/4/008. Epub 2008 Jan 23. Phys Med Biol. 2008. PMID: 18263950
-
Fiber optic probes for biomedical optical spectroscopy.J Biomed Opt. 2003 Jan;8(1):121-47. doi: 10.1117/1.1528207. J Biomed Opt. 2003. PMID: 12542388 Review.
Cited by
-
Measuring mucosal blood supply in vivo with a polarization-gating probe.Appl Opt. 2008 Nov 10;47(32):6046-57. doi: 10.1364/ao.47.006046. Appl Opt. 2008. PMID: 19002229 Free PMC article.
-
Evaluation of a fiberoptic-based system for measurement of optical properties in highly attenuating turbid media.Biomed Eng Online. 2006 Aug 23;5:49. doi: 10.1186/1475-925X-5-49. Biomed Eng Online. 2006. PMID: 16928274 Free PMC article.
-
Extraction of intrinsic fluorescence from single fiber fluorescence measurements on a turbid medium: experimental validation.Biomed Opt Express. 2014 May 22;5(6):1913-25. doi: 10.1364/BOE.5.001913. eCollection 2014 Jun 1. Biomed Opt Express. 2014. PMID: 24940549 Free PMC article.
-
Optical biomarkers of serous and mucinous human ovarian tumor assessed with nonlinear optics microscopies.PLoS One. 2012;7(10):e47007. doi: 10.1371/journal.pone.0047007. Epub 2012 Oct 8. PLoS One. 2012. PMID: 23056557 Free PMC article.
-
Sub-millimeter resolution 3D optical imaging of living tissue using laminar optical tomography.Laser Photon Rev. 2009 Feb 1;3(1-2):159-179. doi: 10.1002/lpor.200810031. Laser Photon Rev. 2009. PMID: 19844595 Free PMC article.
References
-
- Pfefer TJ, Matchette LS, Ross AM, Ediger MN. Selective detection of fluorophore layers in turbid media: the role of fiber-optic probe design. Opt Lett. 2003;28(2):120–122. - PubMed
-
- Ramanujam N. Fluorescence Spectroscopy in vivo. In: Meyers R, editor. Encyclopedia of Analytical Chemistry. Chichester: John Wiley & Sons Ltd; 2000. pp. 20–56.
-
- Drezek R, Brookner C, Pavlova I, Boiko I, Malpica A, Lotan R, Follen M, Richards-Kortum R. Autofluorescence microscopy of fresh cervical-tissue sections reveals alterations in tissue biochemistry with dysplasia. Photochem Photobiol. 2001;73(6):636–641. - PubMed
-
- Pavlova I, Sokolov K, Drezek R, Malpica A, Follen M, Richards-Kortum R. Microanatomical and biochemical origins of normal and precancerous cervical autofluorescence using laser-scanning fluorescence confocal microscopy. Photochem Photobiol. 2003;77(5):550–555. - PubMed
Publication types
MeSH terms
Grants and funding
LinkOut - more resources
Full Text Sources
Other Literature Sources
Medical
