. 2004 Feb 10;101(6):1543-7.
doi: 10.1073/pnas.0306458101. Epub 2004 Feb 2.

The metabolic world of Escherichia coli is not small

Affiliations

The metabolic world of Escherichia coli is not small

Masanori Arita. Proc Natl Acad Sci U S A. .

Abstract

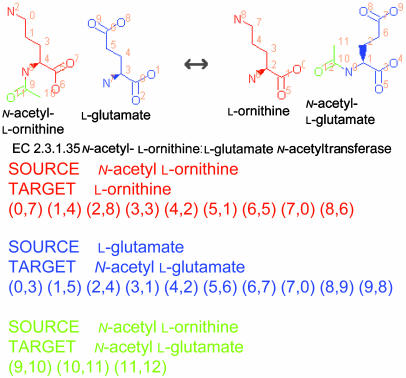
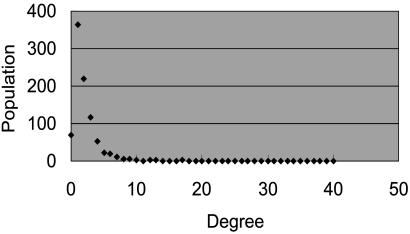
To elucidate the organizational and evolutionary principles of the metabolism of living organisms, recent studies have addressed the graph-theoretic analysis of large biochemical networks responsible for the synthesis and degradation of cellular building blocks [Jeong, H., Tombor, B., Albert, R., Oltvai, Z. N. & Barabási, A. L. (2000) Nature 407, 651-654; Wagner, A. & Fell, D. A. (2001) Proc. R. Soc. London Ser. B 268, 1803-1810; and Ma, H.-W. & Zeng, A.-P. (2003) Bioinformatics 19, 270-277]. In such studies, the global properties of the network are computed by considering enzymatic reactions as links between metabolites. However, the pathways computed in this manner do not conserve their structural moieties and therefore do not correspond to biochemical pathways on the traditional metabolic map. In this work, we reassessed earlier results by digitizing carbon atomic traces in metabolic reactions annotated for Escherichia coli. Our analysis revealed that the average path length of its metabolism is much longer than previously thought and that the metabolic world of this organism is not small in terms of biosynthesis and degradation.


Figures

Fig. 1.
Fig. 1.
Two representations of the EC 2.3.1.35 reaction. In this reaction, the acetyl moiety of N-acetyl l-ornithine is transferred to l-glutamate to form N-acetyl l-glutamate. (Lower Left) In the scheme of Jeong et al. (7), its two substrates and two products are equally linked to the object representing the EC number, irrespective of their structural changes. (Lower Right) In our scheme, conserved substructural moieties, coded by color, are computationally detected, and each link is associated with the information of which atom goes where.
Fig. 2.
Fig. 2.
Three atomic mappings for the EC 2.3.1.35 reaction. Each reaction formula is decomposed to a set of substructural correspondences coded by color: each color indicates a set of atomic position pairs called an atomic mapping. Atomic positions are line numbers in the MOL file format files (see Methods for details) and are not generalizable to other metabolic databases.
Fig. 3.
Fig. 3.
Graph representation of the ornithine biosynthetic pathway. In ornithine biosynthesis, l-ornithine (l-Orn) is synthesized from l-glutamate (l-Glu) through five reactions. Red arrows indicate the transfer of the carbon skeleton of l-glutamate, blue arrows indicate the transfer of acetyl moiety, and green arrows indicate the transfer of a nitrogen atom from l-glutamate. (Left) In the traditional metabolic map, multiple substrates and products are involved in each reaction, and their structural relationships are implicit. (Right) In our graph representation, physically related metabolites are linked with atomic mappings (red and blue arrows), and each reaction corresponds to a set of mappings (orange links). Note that the mapping between l-glutamate and N-acetyl l-glutamate (N-Ace l-Glu) is shared by two reactions (EC 2.3.1.1 and EC 2.3.1.35). The mapping between l-ornithine and N-acetyl l-ornithine (N-Ace l-Orn) is also shared. p, Phosphate; sa, semialdehyde.
Fig. 4.
Fig. 4.
Pathway from pyruvate to fumarate. Highlighted positions show the traces of two carbon atoms in pyruvate (positions 0 and 1). Because the two positions in fumarate ( and 3) are equivalent, all highlighted positions become equivalent when reactions are considered reversible.
Fig. 5.
Fig. 5.
Distribution of pathway length. Filled bars indicate the population of pathways when the direction of reactions is considered (i.e., directed graph). Open bars indicate the population when all reactions are considered reversible (undirected graph).
Fig. 6.
Fig. 6.
Degree distribution of the graph. Degree corresponds to the number of structural changes, not frequencies.

References

    1. Watts, D. J. & Strogatz, S. H. (1998) Nature 393, 440-442. - PubMed
    1. Strogatz, S. H. (2001) Nature 410, 268-276. - PubMed
    1. Girvan, M. & Newman, M. E. (2002) Proc. Natl. Acad. Sci. USA 99, 7821-7826. - PMC - PubMed
    1. Fell, D. A. & Wagner, A. (2000) Nat. Biotechnol. 18, 1121-1122. - PubMed
    1. Wagner, A. & Fell, D. A. (2001) Proc. R. Soc. London Ser. B 268, 1803-1810. - PMC - PubMed

MeSH terms