. 2004 Feb 10;101(6):1607-12.
doi: 10.1073/pnas.0305096101. Epub 2004 Feb 2.

Constitutive and inducible trypsin proteinase inhibitor production incurs large fitness costs in Nicotiana attenuata

Affiliations

Constitutive and inducible trypsin proteinase inhibitor production incurs large fitness costs in Nicotiana attenuata

Jorge A Zavala et al. Proc Natl Acad Sci U S A. .

Abstract

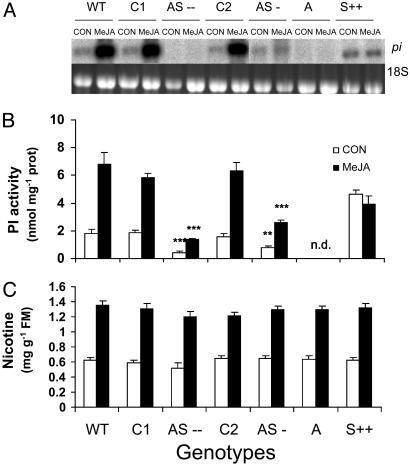
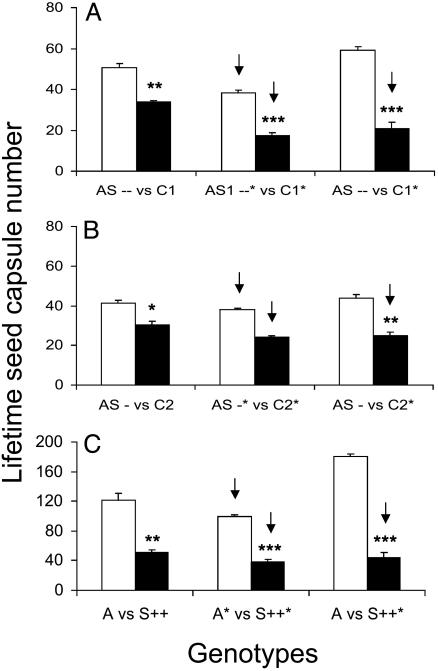
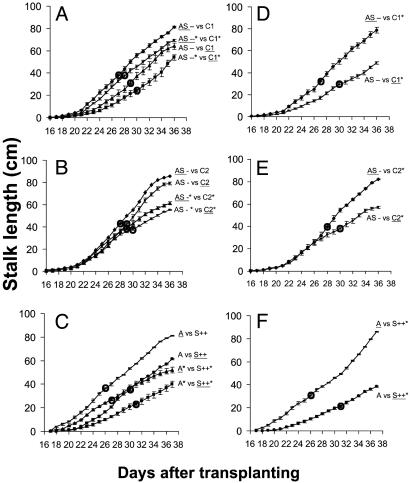
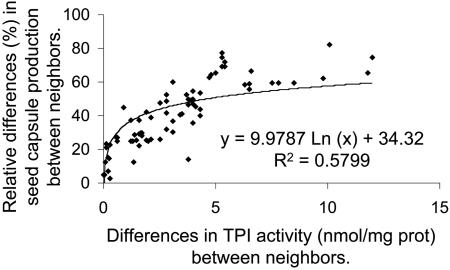
Plant trypsin proteinase inhibitors (TPIs) are potent herbivore- and jasmonate (JA)-induced defenses, but support for the commonly invoked explanation for their inducible expression, namely their associated fitness costs, has been elusive. To determine whether the expression of TPIs incurs fitness costs, we expressed 175 bp of the seven-domain pi from Nicotiana attenuata in an antisense orientation in a TPI-producing genotype (WT) of N. attenuata to reduce TPI expression. Moreover, we expressed the full-length seven-domain pi in a sense orientation under control of a constitutive promoter to restore TPI activity in a natural genotype unable to produce TPIs because of a mutation in its endogenous pi gene. Lifetime reproductive output was determined from high and low TPI-producing plants of the same genetic background with and without JA elicitation and grown in the same pot to simulate natural competitive and nutrient regimes. Transformants with either low or no TPI activity grew faster and taller, flowered earlier, and produced more seed capsules (25-53%) than did neighboring TPI-producing genotypes, and JA elicitation increased TPI production and decreased seed capsule production further. Growth under high light levels only marginally reduced these fitness costs. Results were similar regardless of whether TPI activity was suppressed or restored by transformation: the larger the difference in TPI activity between neighbors, the larger the difference in seed capsule production (R(2) = 0.57). TPI production is costly for a plant's components of fitness when grown under realistic competitive regimes and is consistent with the hypothesis that inducibility evolved as a cost-saving mechanism.


Figures

Fig. 1.
Fig. 1.
Northern blot analysis of TPI mRNA and concentrations of two direct defenses (nicotine and TPI activity) in untransformed WT N. attenuata plants of the Utah genotype; two homozygous T3 independently transformed lines of the Utah genotype that had been transformed either with a construct containing a 175-bp pi gene fragment in an antisense orientation (AS--, AS-) or an empty vector construct (C1, C2); and untransformed plants of the Arizona (A) genotype and plants of a homozygous T3 transformed line of the Arizona genotype transformed with a construct containing the full-length pi gene in a sense (S++) orientation. MeJA (150 μg) in a lanolin paste or pure lanoline (CON) was applied to leaves growing at node +1 (one position older than the source-sink transition leaf: node 0) at the rosette stage 11 days after transplanting. Asterisks indicate the level of significant differences between members of pairs (*, P < 0.05; **, P < 0.001; ***, P < 0.0001). (A) RNA gel blot analysis of pi gene transcripts in +1 leaves of unelicited control (CON) and MeJA-elicited plants 24 h after elicitation [TPI mRNA, 1.4 kb (Upper) and 18S rRNA, 3.4 kb (Lower)]. (B) TPI activity (mean ± SEM) in leaves at node 0 in CON and MeJA-elicited plants 3 d after elicitation. n.d., not detectable. (C) Nicotine concentrations (mean ± SEM) in leaves at node 0 in control (CON) and MeJA-elicited plants 3 d after elicitation. FM, fresh mass.
Fig. 3.
Fig. 3.
Mean (± SEM) lifetime seed capsule number produced by N. attenuata genotypes differing in TPI production (see Fig. 1 for abbreviations) were grown in competition with each other and were either uninduced or elicited with 150 μg (*) of MeJA. Arrows depict the genotype that was elicited with MeJA, and asterisks indicate the level of significant differences between members of pairs (*, P < 0.05; **, P < 0.001; ***, P < 0.0001). (A) Mean (± SEM) capsule number of AS-- (open bars) and C1 (solid bars) genotypes. (B) Mean (± SEM) capsule number of AS- (open bars) and C2 (solid bars) genotypes. (C) Mean (± SEM) capsule number of A (open bars) and S++ (solid bars) genotypes.
Fig. 2.
Fig. 2.
Growth and flowering time of N. attenuata genotypes differing in TPI production (see Fig. 1 for abbreviations) grown in competition with each other and either uninduced or elicited with 150 μg (*) of MeJA. Data shown stalk lengths (mean ± SEM) of the genotype (underlined) starting on the day with measurable stalk growth for 22 subsequent days; circles depict the mean day of first flowering. (A-C) Both competitors from the same pot had the same treatment: either MeJA (*) or control. (D-F) Competitors from the same pot were either treated with MeJA (*) or untreated. Stalk length (mean ± SEM) is shown for AS-- and C1 genotypes (A and D), AS- and C2 genotypes (B and E), and A and S++ genotypes (C and F).
Fig. 4.
Fig. 4.
Relative differences in seed capsule production (as percentages) between neighbors of N. attenuata genotypes that had been transformed with constructs containing the pi gene in an antisense orientation or an empty vector construct, untransformed plants of the Arizona genotype, and plants of the Arizona genotype transformed with constructs containing the full-length pi gene in a sense orientation, regressed against the differences in TPI activity (nmol/mg of protein) between neighbors. The analysis included only plant pairs in which both competitors received the same treatment, either uninduced or induced with 150 μg of MeJA. The line represent a regression fitted to the points [Y = 9.9787 Ln (PI) + 34.32; R2 = 0.5799].

References

    1. Baldwin, I. T. (1998) Proc. Natl. Acad. Sci. USA 95, 8113-8118. - PMC - PubMed
    1. Strauss, S. Y., Rudgers, J. A., Lau, J. A. & Irwin, R. E. (2002) Trends Ecol. Evol. 17, 278-285.
    1. Cipollini, D. F., Purrington, C. B. & Bergelson, J. (2003) Basic Appl. Ecol. 4, 79-85.
    1. Hare, D. J., Elle, E. & van Dam, N. M. (2003) Evolution 57, 793-805. - PubMed
    1. Feeny, P. P. (1976) Recent Adv. Phytochem. 10, 1-40.

Publication types

Substances

Associated data