. 2004;5(2):R7.
doi: 10.1186/gb-2004-5-2-r7. Epub 2004 Jan 15.

A comprehensive evolutionary classification of proteins encoded in complete eukaryotic genomes

Affiliations

A comprehensive evolutionary classification of proteins encoded in complete eukaryotic genomes

Eugene V Koonin et al. Genome Biol. 2004.

Abstract

Background: Sequencing the genomes of multiple, taxonomically diverse eukaryotes enables in-depth comparative-genomic analysis which is expected to help in reconstructing ancestral eukaryotic genomes and major events in eukaryotic evolution and in making functional predictions for currently uncharacterized conserved genes.

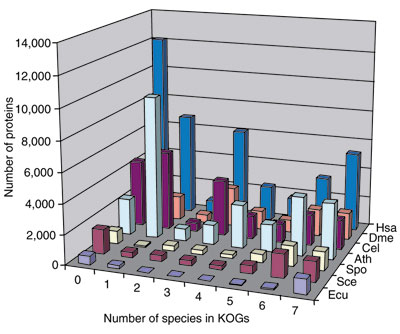
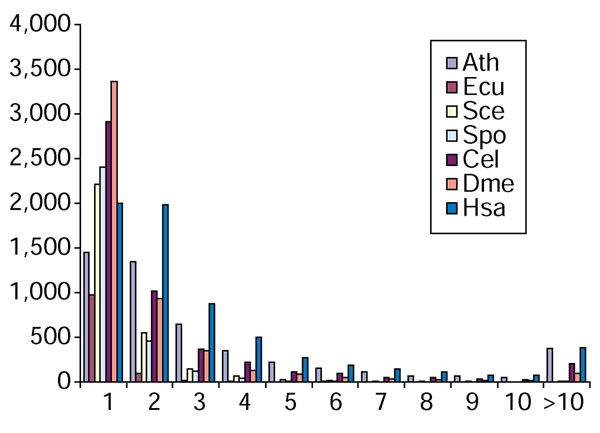
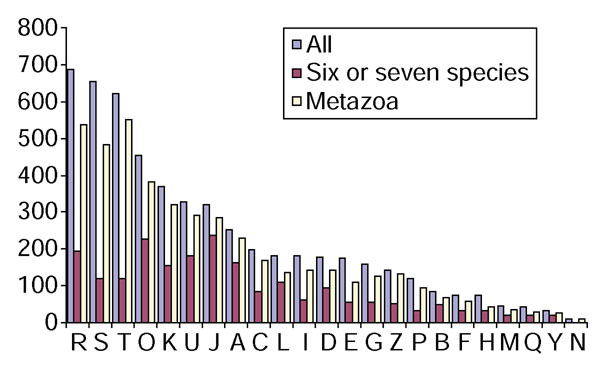
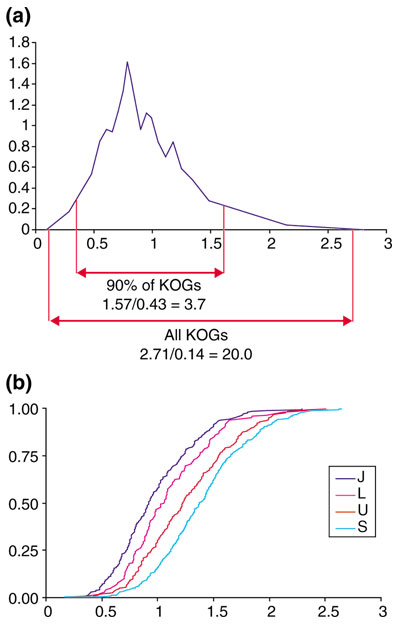
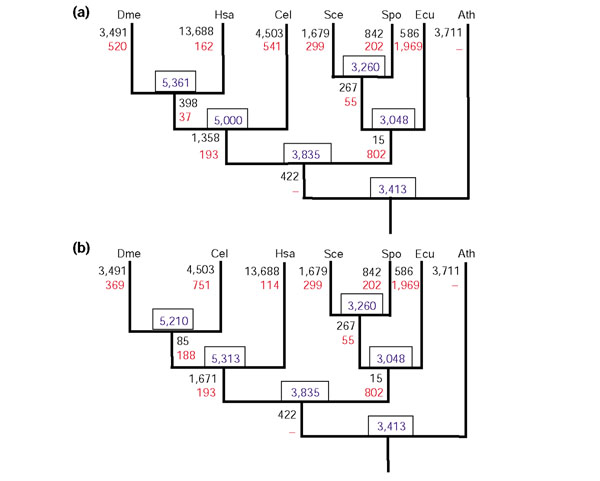
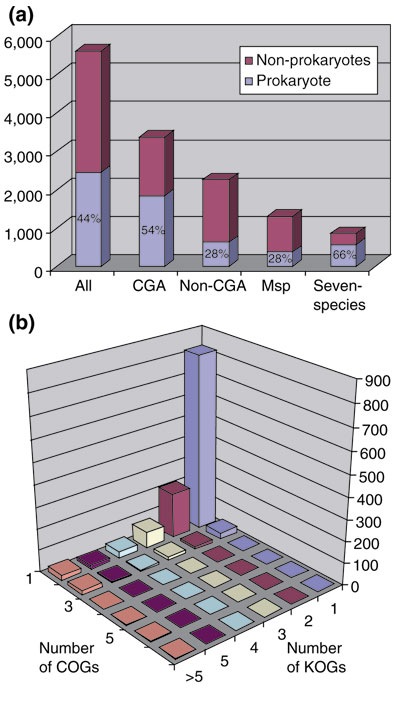
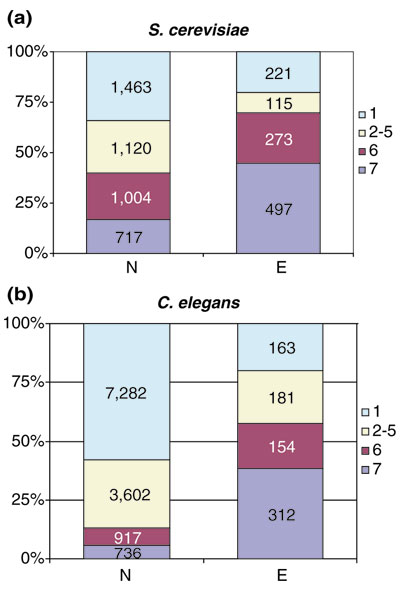
Results: We examined functional and evolutionary patterns in the recently constructed set of 5,873 clusters of predicted orthologs (eukaryotic orthologous groups or KOGs) from seven eukaryotic genomes: Caenorhabditis elegans, Drosophila melanogaster, Homo sapiens, Arabidopsis thaliana, Saccharomyces cerevisiae, Schizosaccharomyces pombe and Encephalitozoon cuniculi. Conservation of KOGs through the phyletic range of eukaryotes strongly correlates with their functions and with the effect of gene knockout on the organism's viability. The approximately 40% of KOGs that are represented in six or seven species are enriched in proteins responsible for housekeeping functions, particularly translation and RNA processing. These conserved KOGs are often essential for survival and might approximate the minimal set of essential eukaryotic genes. The 131 single-member, pan-eukaryotic KOGs we identified were examined in detail. For around 20 that remained uncharacterized, functions were predicted by in-depth sequence analysis and examination of genomic context. Nearly all these proteins are subunits of known or predicted multiprotein complexes, in agreement with the balance hypothesis of evolution of gene copy number. Other KOGs show a variety of phyletic patterns, which points to major contributions of lineage-specific gene loss and the 'invention' of genes new to eukaryotic evolution. Examination of the sets of KOGs lost in individual lineages reveals co-elimination of functionally connected genes. Parsimonious scenarios of eukaryotic genome evolution and gene sets for ancestral eukaryotic forms were reconstructed. The gene set of the last common ancestor of the crown group consists of 3,413 KOGs and largely includes proteins involved in genome replication and expression, and central metabolism. Only 44% of the KOGs, mostly from the reconstructed gene set of the last common ancestor of the crown group, have detectable homologs in prokaryotes; the remainder apparently evolved via duplication with divergence and invention of new genes.

Conclusions: The KOG analysis reveals a conserved core of largely essential eukaryotic genes as well as major diversification and innovation associated with evolution of eukaryotic genomes. The results provide quantitative support for major trends of eukaryotic evolution noticed previously at the qualitative level and a basis for detailed reconstruction of evolution of eukaryotic genomes and biology of ancestral forms.


Figures

Figure 1
Figure 1
Assignment of proteins from each of the seven analyzed eukaryotic genomes to KOGs with different numbers of species and to LSEs. 0, Proteins without detectable homologs (singletons); 1, LSEs. Species abbreviations: Ath, Arabidopsis thaliana; Cel, Caenorhabditis elegans; Dme, Drosophila melanogaster; Ecu, Encephalitozoon cuniculi; Hsa, Homo sapiens; Sce, Saccharomyces cerevisisae; Spo, Schizosaccharomyces pombe.
Figure 2
Figure 2
Distribution of the KOGs by the number of paralogs in each of the analyzed eukaryotic genomes. The species abbreviations are as in Figure 1.
Figure 3
Figure 3
Functional breakdown of the KOGs. Designations of functional categories: A, RNA processing and modification; B, chromatin structure and dynamics; C, energy production and conversion; D, cell-cycle control and mitosis; E, amino acid metabolism and transport; F, nucleotide metabolism and transport; G, carbohydrate metabolism and transport; H, coenzyme metabolism; I, lipid metabolism; J, translation; K, transcription; L, replication and repair; M, membrane and cell wall structure and biogenesis; O, post-translational modification, protein turnover, chaperone functions; P, inorganic ion transport and metabolism; Q, secondary metabolites biosynthesis, transport and catabolism; T, signal transduction; U, intracellular trafficking and secretion; Y, nuclear structure; Z, cytoskeleton; R, general functional prediction only (typically, prediction of biochemical activity), S, function unknown. This breakdown is only for KOGs that included at least three species.
Figure 4
Figure 4
Variation of amino-acid substitution rates among KOGs. (a) Probability-density function for the distribution of evolutionary rates among the set of KOGs including all seven analyzed eukaryotic species. (b) Distribution functions for the evolutionary rates in different functional categories of KOGs. The designations of functional categories are as in Figure 3.
Figure 5
Figure 5
Parsimonious scenarios of loss and emergence of genes (KOGs) in eukaryotic evolution. (a) The coelomate topology of the phylogenetic tree of the eukaryotic crown group. (b) The ecdysozoan topology of the phylogenetic tree of the eukaryotic crown group. The numbers in boxes indicate the inferred number of KOGs in the respective ancestral forms. The numbers next to branches indicate the number of gene gains (emergence of KOGs) (numerator) and gene (KOG) losses (denominator) associated with the respective branches; a dash indicates that the number of losses for a given branch could not be determined. Proteins from each genome that did not belong to KOGs as well as LSEs were counted as gains on the terminal branches. The species abbreviations are as in Figure 1.
Figure 6
Figure 6
Correspondence between eukaryotic and prokaryotic orthologous gene sets. (a) Representation of prokaryotic counterparts in different subsets of KOGs. CGA, crown group ancestor; non-CGA, KOGs not represented in the crown group ancestor; MSP, metazoa-specific KOGs. (b) Evidence of ancient duplications of eukaryotic genes revealed by the KOGs against COGs comparison. The connections between KOGs and COGs detected by using RPS-BLAST (see text) were analyzed by single linkage clustering.
Figure 7
Figure 7
Gene dispensability in yeast and worm and phyletic patterns of the respective KOGs. (a) Distribution of essential and non-essential genes among different size classes of KOGs and LSEs in yeast Saccharomyces cerevisiae. (b) Distribution of essential and non-essential genes among different size classes of KOGs and LSEs in the nematode C. elegans. The number of species in the KOGs and LSEs is color-coded as indicated to the right of each plot.

Similar articles

Cited by

References

    1. Doolittle WF. Lateral genomics. Trends Cell Biol. 1999;9:M5–M8. doi: 10.1016/S0962-8924(99)01664-5. - DOI - PubMed
    1. Doolittle WF. Phylogenetic classification and the universal tree. Science. 1999;284:2124–2129. doi: 10.1126/science.284.5423.2124. - DOI - PubMed
    1. Koonin EV, Aravind L, Kondrashov AS. The impact of comparative genomics on our understanding of evolution. Cell. 2000;101:573–576. - PubMed
    1. Koonin EV, Makarova KS, Aravind L. Horizontal gene transfer in prokaryotes: quantification and classification. Annu Rev Microbiol. 2001;55:709–742. doi: 10.1146/annurev.micro.55.1.709. - DOI - PMC - PubMed
    1. Snel B, Bork P, Huynen MA. Genomes in flux: the evolution of archaeal and proteobacterial gene content. Genome Res. 2002;12:17–25. doi: 10.1101/gr.176501. - DOI - PubMed