. 2004 Feb 9;90(3):686-92.
doi: 10.1038/sj.bjc.6601603.

Predicting biomarkers for ovarian cancer using gene-expression microarrays

Affiliations

Predicting biomarkers for ovarian cancer using gene-expression microarrays

T R Adib et al. Br J Cancer. .

Abstract

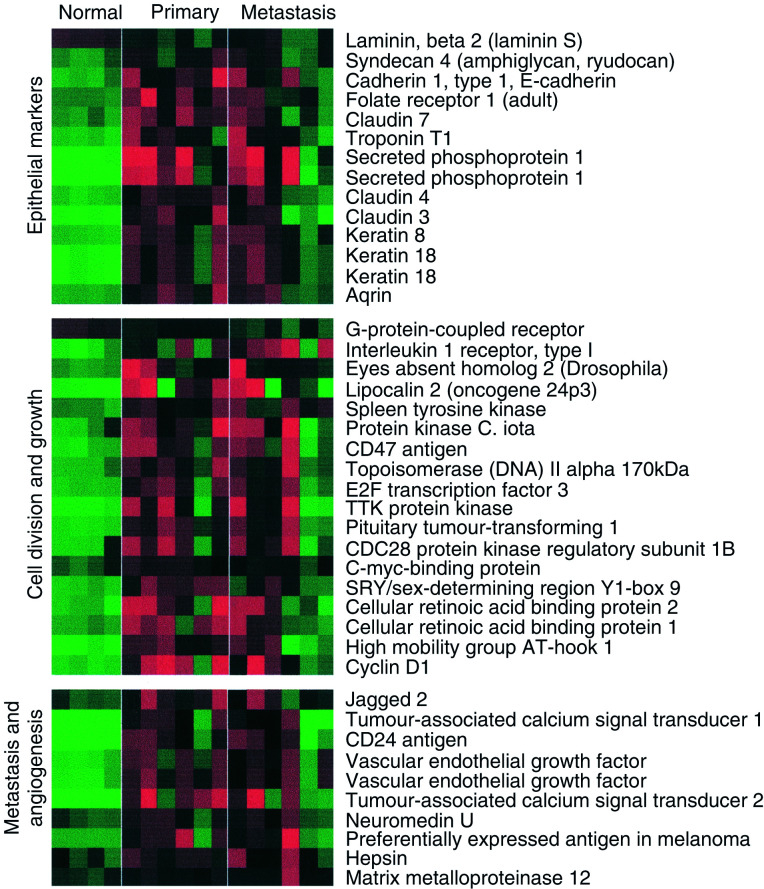
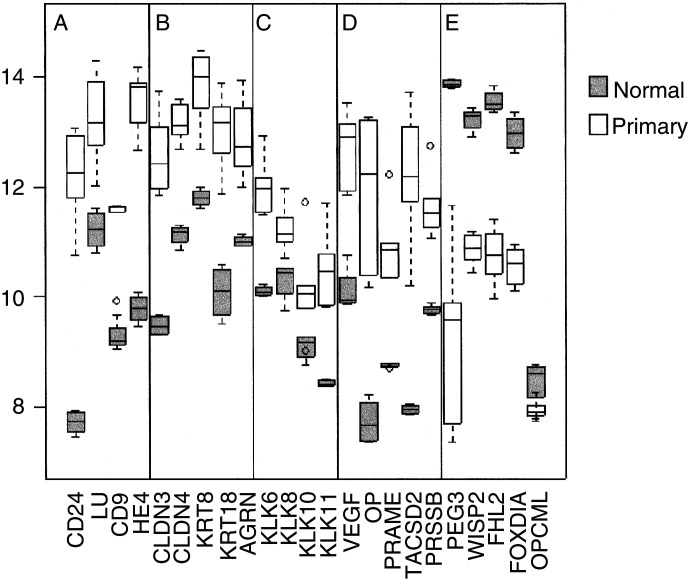
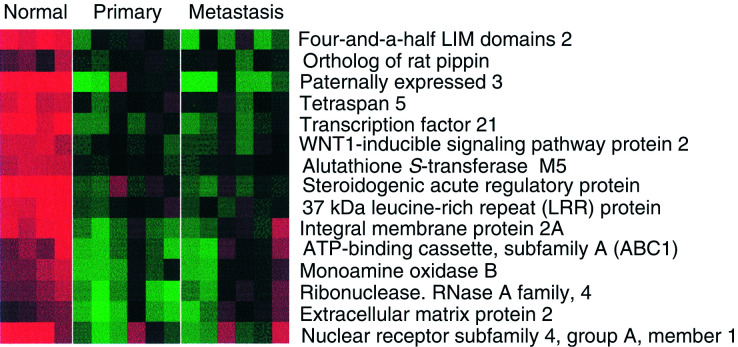
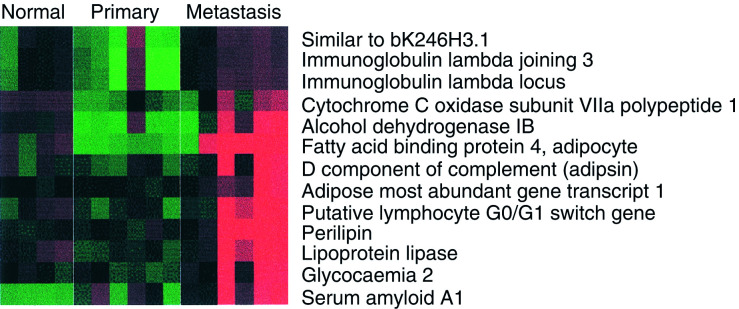
Ovarian cancer has the highest mortality rate of gynaecological cancers. This is partly due to the lack of effective screening markers. Here, we used oligonucleotide microarrays complementary to approximately 12 000 genes to establish a gene-expression microarray (GEM) profile for normal ovarian tissue, as compared to stage III ovarian serous adenocarcinoma and omental metastases from the same individuals. We found that the GEM profiles of the primary and secondary tumours from the same individuals were essentially alike, reflecting the fact that these tumours had already metastasised and acquired the metastatic phenotype. We have identified a novel biomarker, mammaglobin-2 (MGB2), which is highly expressed specific to ovarian cancer. MGB2, in combination with other putative markers identified here, could have the potential for screening.


Figures

Figure 1
Figure 1
Heatmap showing genes upregulated in serious ovarian primary and omental metastatic tumours compared to the normal ovary. Columns represent individual tissue samples; rows represent individual genes. Red and green cells represent transcript levels for each gene across the samples above and below the median, respectively. All differences are significant at the P<0.05 level after multiple testing adjustment (see Materials and methods).
Figure 2
Figure 2
Box and whisker plots show expression of selected genes in both normal (shaded, n=4) and primary tissues (unshaded, n=6). The selected genes are split into five categories (AE) from left to right: (A) for comparison with previous ovarian cancer GEM studies, (B) epithelial markers, (C) kallikrein serine protease family, (D) a selection of previously described serious ovarian cancer markers and (E) genes with loss of expression in primary tumours. Box and whisker plots show a central median line, an interquartile box. Whiskers 1.5 times the interquartile range, and outliers of these, are shown as circles.
Figure 3
Figure 3
Genes downregulated in primary and secondary serous ovarian cancer compared to the normal ovary. All differences are significant at the P<0.05 level after multiple testing adjustment (see Materials and methods).
Figure 4
Figure 4
Genes upregulated in omental metastasis relative to normal ovary and primary ovarian cancer. The predominance of genes associated with adipocytes reflects the omental background. All differences are significant at the P<0.05 level after multiple testing adjustment (see Materials and methods).
Figure 5
Figure 5
Expression of genes in metastatic and primary ovarian cancer samples (n=12, six-paired). The log difference of selected genes between the paired metastatic and primary ovarian cancer samples is plotted (metastatic: primary), so that upwards is higher in metastasis and downwards is lower. The paired P-values were SAA1-0.03, EZH2-0.82, PTTG1-0.47, LMNB1-0.41, ADN-0.04, LPL-0.01, PLIN-0.01 and IGL-0.01.
Figure 6
Figure 6
Immunohistochemical staining for hepsin. Hepsin stained normal and malignant epithelial cells. However, a prominent membrane staining (arrowheads) was only seen in malignant epithelial cells. Pictures × 40; inset × 100.
Figure 7
Figure 7
Comparison of qRT–PCR (clear bars, normal (n=5), primary (n=5), LMP (n=3) and metastasis (n=2)) and GEM data (shaded bars, normal (n=4), primary (n=6) and metastasis (n=6)) for MGB2, SAA1, KLK6 and HPN in normal, primary and omental metastasis samples. Gene-expression microarray data are in original Log2 scale, and qRT–PCR is single Log2 unit per round of amplification, error bars show the standard deviation. The normal level is taken as a 0 baseline reference for both.
Figure 8
Figure 8
Gene-expression profile of putative biomarker MGB2 in ovarian serous adenocarcinoma and a panel of other tissues. Comparison with six previously described biomarkers HPN, IF1-15K, KLK6, CP, SLPI and HE4. Serious ovarian AdC=primary serous ovarian adenocarcinoma, omental metastasis=serious ovarian omental metastasis, lung AdC=lung adenocarcinoma, prostate AdC=prostate adenocarcinoma. Adrenal gland, kidney, liver, pancreas, pituitary gland, lung, spleen, thyroid, trachea and uterus, all represent the corresponding normal tissue specimens.

References

    1. Benjamini Y, Hochberg Y (1995) Controlling the false discovery rate: a practical and powerful approach to multiple testing. J R Statist Soc B 57: 289–300
    1. Bhattacharjee A, Richards WG, Staunton J, Li C, Monti S, Vasa P, Ladd C, Beheshti J, Bueno R, Gillette M, Loda M, Weber G, Mark EJ, Lander ES, Wong W, Johnson BE, Golub TR, Sugarbaker DJ, Meyerson M (2001) Classification of human lung carcinomas by mRNA expression profiling reveals distinct adenocarcinoma subclasses. Proc Natl Acad Sci USA 98: 13790–13795 - PMC - PubMed
    1. Deng Y, Wu X (2000) Peg3/Pw1 promotes p53-mediated apoptosis by inducing Bax translocation from cytosol to mitochondria. Proc Natl Acad Sci USA 97: 12050–12055 - PMC - PubMed
    1. Dhanasekaran SM, Barrette TR, Ghosh D, Shah R, Varambally S, Kurachi K, Pienta KJ, Rubin MA, Chinnaiyan AM (2001) Delineation of prognostic biomarkers in prostate cancer. Nature 412: 822–826 - PubMed
    1. Diamandis EP, Yousef GM (2002) Human tissue kallikreins: a family of new cancer biomarkers. Clin Chem 48: 1198–1205 - PubMed

MeSH terms