. 2004 Feb 25;23(4):719-27.
doi: 10.1038/sj.emboj.7600111. Epub 2004 Feb 12.

Mapping key functional sites within yeast TFIID

Affiliations

Mapping key functional sites within yeast TFIID

Claire Leurent et al. EMBO J. .

Abstract

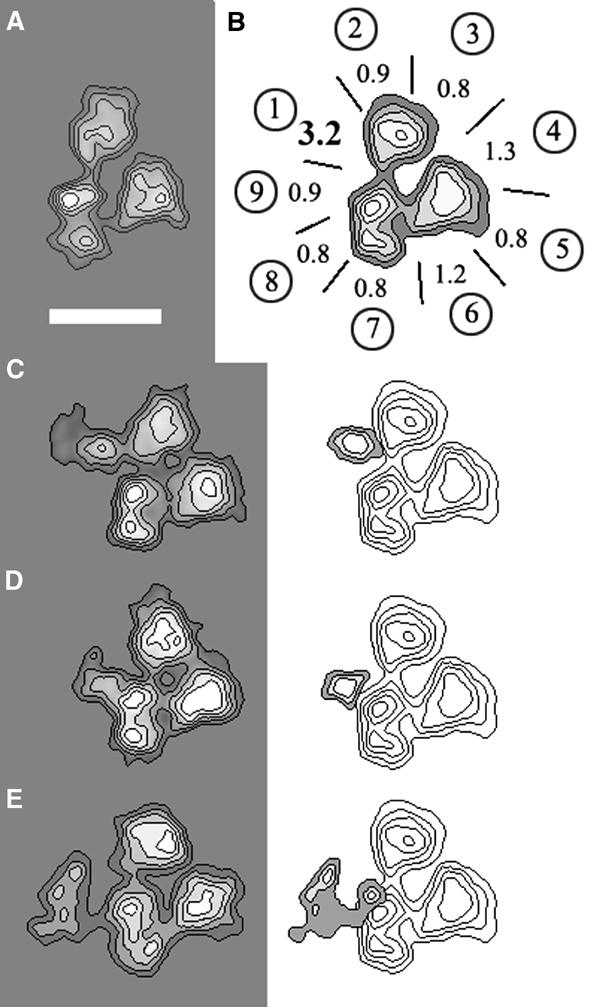
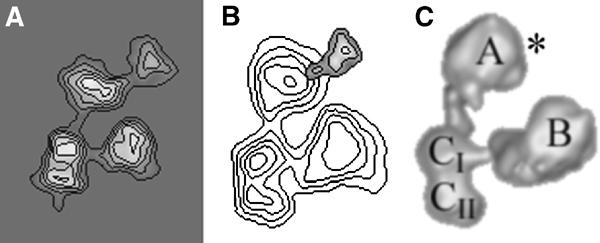
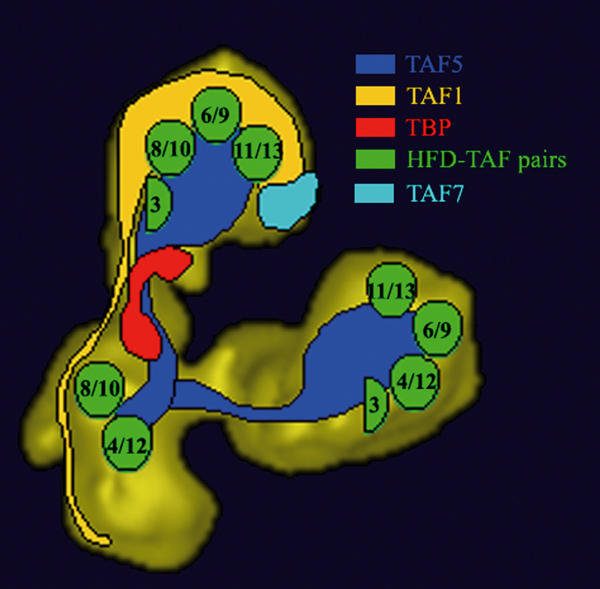
The transcription factor TFIID, composed of the TATA box-binding protein (TBP) and 14 TBP-associated factors (TAFs), plays a key role in the regulation of gene expression by RNA polymerase II. The structure of yeast TFIID, as determined by electron microscopy and digital image analysis, is formed by three lobes, labelled A-C, connected by thin linking domains. Immunomapping revealed that TFIID contains two copies of the WD-40 repeat-containing TAF5 and that TAF5 contributes to the linkers since its C- and N-termini were found in different lobes. This property was confirmed by the finding that a recombinant complex containing TAF5 complexed with six histone fold containing TAFs was able to form a trilobed structure. Moreover, the N-terminal domain of TAF1 was mapped in lobe C, whereas the histone acetyltransferase domain resides in lobe A along with TAF7. TBP was found in the linker domain between lobes A and C in a way that the N-terminal 100 residues of TAF1 are spanned over it. The implications of these data with regard to TFIID function are discussed.


Figures

Figure 1
Figure 1
Immunolabelling of TBP. (A) Characteristic trilobed view of TFIID that is used throughout this report to identify the antibody-labelled site, represented with isodensity contour levels. (B) Mapping of the TBP-specific pAb-binding site at the outer contour of the trilobed TFIID view. Each lobe A, B and C is divided into three sectors labelled as in Table I (A 1,2,3; B 4,5,6; C 7,8,9). The values indicated for each sector represent deviations from the average binding frequency (in sigma folds). (C, D) Average images of TFIID molecules specifically labelled with the anti-TBP pAb (left panel) and density difference map with an unlabelled TFIID (right panel). (E) Average image of TFIID molecules in which the N-terminally HA-tagged TBP is labelled with an anti-HA antibody (left panel) and difference map with an unlabelled TFIID molecule (right panel). The bar represents 15 nm.
Figure 2
Figure 2
Immunolabelling of TAF1 domains. (A) Schematic representation of the structural and functional features of yTAF1. In (B–E), the stars below the inset indicate the portion of TAF1 recognized by the antibodies used. (B) Average images of TFIID molecules specifically labelled with a pAb raised against full-length TAF1 (Ab1-TAF1). Several classes of images differing by the position of the antibody-binding site were found and likely correspond to distinct epitopes (left panel). The density difference maps between the various labelled classes and the unlabelled TFIID were aggregated into a single diagram for clarity (upper right panel). The lower right panel summarized the results obtained with Ab1-TAF1 by mapping the labelled sites on the previously obtained 3-D model of TFIID (Leurent et al, 2002). (C) Average images of TFIID molecules specifically labelled with a pAb raised against the first 100 amino acids of TAF1 (Ab2-TAF1) are depicted in the left panel. The aggregated density difference maps are shown in the right panel and indicate that lobe C is labelled in different regions. (D) Average image of TFIID molecules HA-tagged on the N-terminus of TAF1 and labelled with an anti-HA antibody (Ab3-TAF1). The difference map (right panel) indicates that a single site is labelled in lobe CII. (E) Average image of TFIID molecules HA-tagged on the C-terminus of TAF1 and labelled with an anti-HA antibody (Ab4-TAF1). The difference map (right panel) indicates that a single site is labelled in lobe A.
Figure 3
Figure 3
Immunolabelling of TAF7 with a subunit-specific pAb. (A) Average images of yTFIID molecules specifically labelled with a pAb raised against yTAF7. (B) Statistically significant difference map between the labelled and the unlabelled yTFIID molecules. (C) Position of the labelled sites on the 3-D model of TFIID highlighted by an asterisk.
Figure 4
Figure 4
Labelling of the N- and C-terminal ends of TAF5. (A) Schematic representation of the structural features of TAF5 showing the WD-40 repeats and the 30 kDa tag for tandem affinity purification (TAP) that was introduced at the C-terminus of TAF5. (B) Average image of TFIID molecules in which TAF5 was fused to the TAP tag (left panel) and statistically significant density difference map with wild-type TFIID molecules (right panel). The difference map shows two additional densities located in lobes A and B. (C) Average images of TFIID containing TAP-tagged TAF5 subunits. The TAP tag was localized with an antibody to reveal the protein A moiety (left panels) and difference maps with nonlabelled TFIID molecules (right panels). Two distinct labelled particles were obtained that were labelled either in lobe B (upper panel) or in lobe A (lower panel), thus confirming the position of the TAP tag placed at the C-terminus of TAF5. (D) Average images of yTFIID molecules specifically labelled with a pAb raised against the first 18 residues of TAF5 (left panel) and corresponding difference map (right panel).
Figure 5
Figure 5
Analysis of a recombinant complex containing seven TAFs. (A) Seven TAFs (hTAF4, 5, 6, 9, 10, 12 and mTAF8) were coexpressed in Sf9 cells and the TAF10-containing complexes were purified using a TAF10-specific antibody. The bound complexes were eluted and separated by gel filtration on a Superdex 200 column. (A) SDS–PAGE analysis and silver staining of the collected fractions showing the formation of a homogeneous complex in fraction 14 with an estimated molecular weight of 800 kDa. The elution of molecular weight standards is indicated (top). (B) Western blot analysis showing that the seven TAFs coelute in the peak fractions of the Superdex 200 gel filtration profile. (C) Western blot analysis of anti-TAF10 immunoprecipitation (IP) experiments. Lane 1, coexpression of the seven TAFs; lane 2, TAF5 is missing in the coexpression; lane 3, TAF10 is missing in the coexpression. (D) Electron microscopic observation of the peak fraction 14 reveals a homogeneous population of complexes in negative stain. (E) Image analysis of the seven-TAF complex reveals a TFIID-like trilobed structure. The bar represents 50 nm in (D) and 13.5 nm in (E).
Figure 6
Figure 6
Summary of the immunolabelling experiments. Proposed location of TAFs within the 3-D model of yTFIID. The location of histone fold-containing TAF pairs is schematically represented by green circles as determined previously (Leurent et al, 2002). The extended TAF1 and TAF5 subunits are schematically represented to highlight their presence in two lobes, Note that the size and shape of the coloured areas does not directly correspond to polypeptide mass.

Similar articles

Cited by

References

    1. Andel F, Ladurner AG, Inouye C, Tjian R, Nogales E (1999) Three-dimensional structure of the human TFIID–IIA–IIB complex. Science 286: 2153–2156 - PubMed
    1. Bai Y, Perez GM, Beechem JM, Weil PA (1997) Structure–function analysis of TAF130: identification and characterization of a high-affinity TATA-binding protein interaction domain in the N terminus of yeast TAF(II)130. Mol Cell Biol 17: 3081–3093 - PMC - PubMed
    1. Banik U, Beechem JM, Klebanow E, Schroeder S, Weil PA (2001) Fluorescence-based analyses of the effects of full-length recombinant TAF130p on the interaction of TATA box-binding protein with TATA box DNA. J Biol Chem 276: 49100–49109 - PubMed
    1. Brand M, Leurent C, Mallouh V, Tora L, Schultz P (1999) Three-dimensional structures of the TAFII-containing complexes TFIID and TFTC. Science 286: 2151–2153 - PubMed
    1. Buratowski S, Hahn S, Guarente L, Sharp PA (1989) Five intermediate complexes in transcription initiation by RNA polymerase II. Cell 56: 549–561 - PubMed

Publication types

MeSH terms