. 2004 Feb 25;23(4):772-9.
doi: 10.1038/sj.emboj.7600097. Epub 2004 Feb 12.

A troponin switch that regulates muscle contraction by stretch instead of calcium

Affiliations

A troponin switch that regulates muscle contraction by stretch instead of calcium

Bogos Agianian et al. EMBO J. .

Abstract

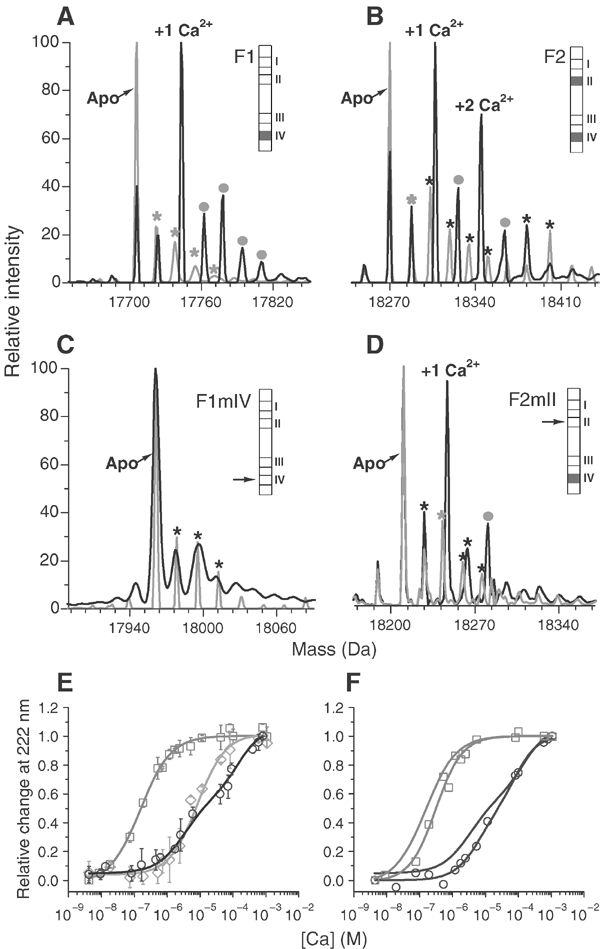
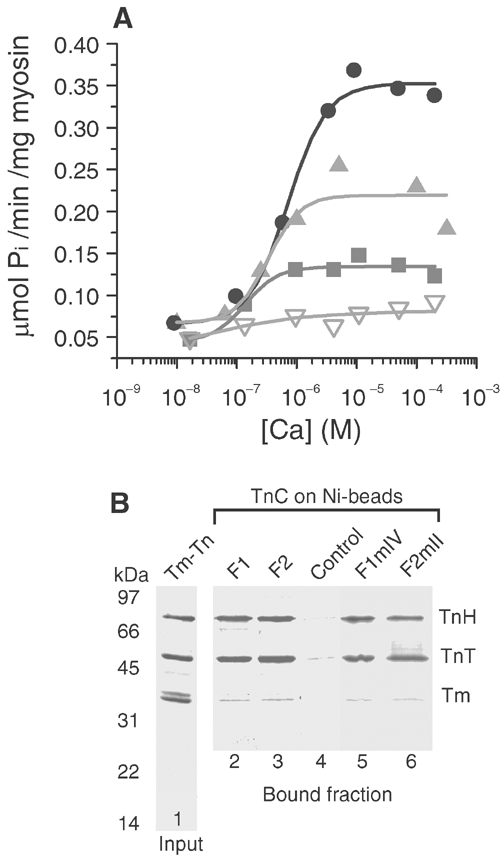
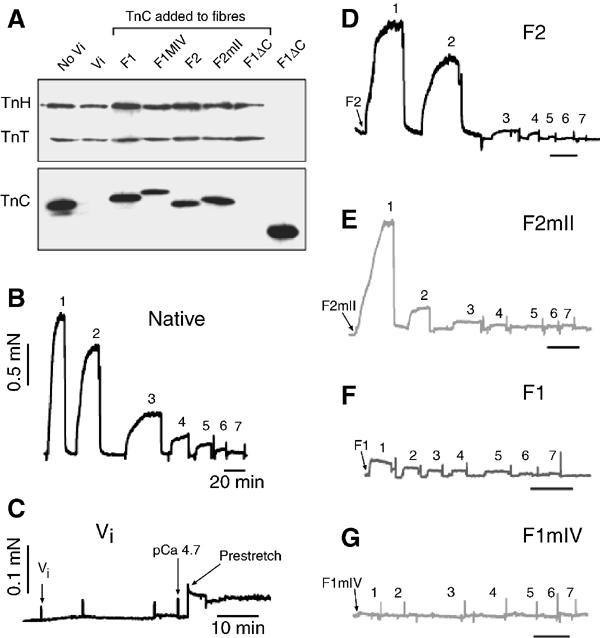
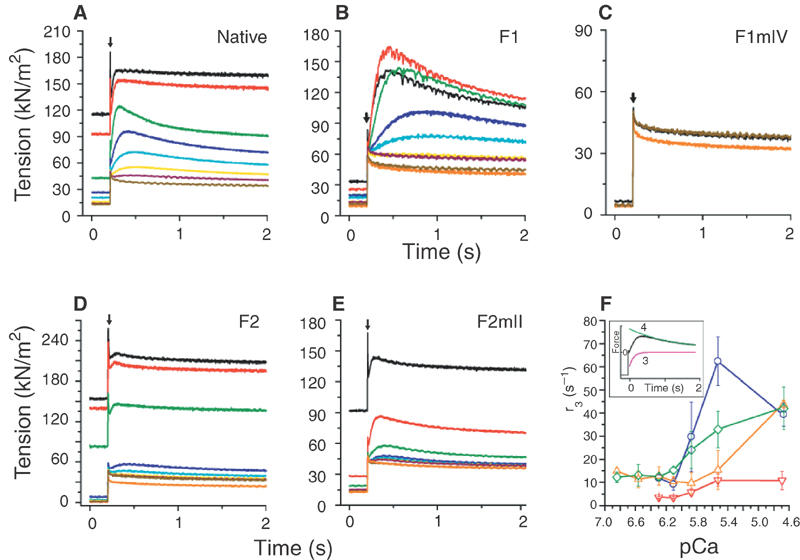
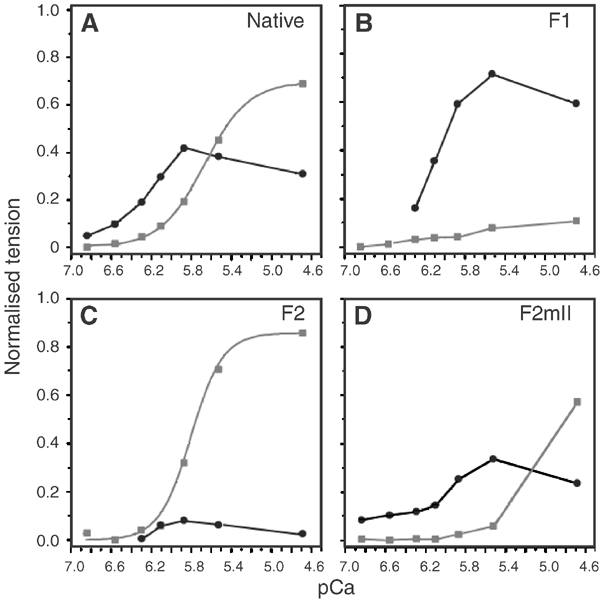
The flight muscles of many insects have a form of regulation enabling them to contract at high frequencies. The muscles are activated by periodic stretches at low Ca2+ levels. The same muscles also give isometric contractions in response to higher Ca2+. We show that the two activities are controlled by different isoforms of TnC (F1 and F2) within single myofibrils. F1 binds one Ca2+ with high affinity in the C-terminal domain and F2 binds one Ca2+ in the C-terminal domain and one exchangeable Ca2+ in the N-terminal domain. We have characterised the isoforms and determined their effect on the development of stretch-activated and Ca2+-activated tension by replacing endogenous TnC in Lethocerus flight muscle fibres with recombinant isoforms. Fibres with F1 gave stretch-activated tension and minimal isometric tension; those with F2 gave Ca2+-dependent isometric tension and minimal stretch-activated tension. Regulation by a TnC responding to stretch rather than Ca2+ is unprecedented and has resulted in the ability of insect flight muscle to perform oscillatory work at low Ca2+ concentrations, a property to which a large number of flying insects owe their evolutionary success.


Figures

Figure 1
Figure 1
Stoichiometry and affinity of Ca2+ binding to TnC isoforms. (A–D) ESI-MS analysis of apo (grey) and Ca2+-loaded (black) TnC: (A) F1, (B) F2, (C) F1mIV, (D) F2mII. Minor apo-species within the apo-protein sample that are additively oxidised [+O16] (grey stars) and their corresponding oxidised-protein-Ca2+ adducts (grey dots) are marked; black stars are apoprotein adducts that do not bind Ca2+. Schematic bar diagrams of TnC sequences show Ca2+-binding sites I–IV. Filled sites are shown in grey, arrows indicate mutated sites; (E) Ca2+ titration of CD change in F1 (grey squares), F2 (black circles), F2mII (grey diamonds); values are mean±s.d. (n=5). (F) Effect of Mg2+ (1 mM) on Ca2+ titration of the CD change in F1 and F2 (symbols as in (E); values are the mean of two estimations. For comparison, titrations in the absence of Mg2+ are shown without symbols. See text for details.
Figure 2
Figure 2
Effect of TnC isoforms on actomyosin ATPase. (A) Ca2+ dependence of ATPase with Tm–Tn reconstituted with F2 (black circles), F2mII (light grey triangles), F1 (dark grey squares) and F1mIV (inverted open triangles). K50 for F2 was 7.0 (±0.3) × 10−7 M; for F2mII it was 3.3 (±1.2) × 10−7 M and for F1 it was 1.4(±0.6) × 10−7 M (mean±s.d., n=3). (B) SDS–PAGE of Tm–Tn (lane 1) and TnC-binding assay. Lanes 2–6, fraction of Tm–Tn retained by TnCs on Ni-NTA-agarose beads; TnC isoforms on the beads are shown above the gel lanes (control, empty beads). TnT and TnH bind to all TnCs and the affinity is greater than that for Tm, which did not bind to the TnC-beads.
Figure 3
Figure 3
Effect of TnC isoforms on isometric tension in fibres. (A) Western blot of fibre bundles from which TnC was removed with vanadate (Vi) and replaced by different isoforms. First two lanes, fibres before and after removal of TnC; following lanes, replacement with TnC isoforms indicated; last lane, F1ΔC alone. Fibre bundles did not contain equal numbers of fibres. The blot was incubated in mixed anti-TnT, -TnH and -TnC. (B) Isometric tension in native fibres in solutions with decreasing free Ca2+ (1–7); fibres were put into relaxing solution between each contraction (see Methods). (C) Fibres after vanadate treatment, showing loss of tension response. (D–G) Isometric tension in vanadate-treated fibres with added TnC: (D) F2, (E) F2mII, (F) F1, (G) F1mIV; force bar in (B) also applies to traces (DG) and time bars are 20 min. Spikes represent fibre stretching or buffer exchange. pCa from 1 to 7: 4.7, 5.5, 5.9, 6.1, 6.3, 6.6, 6.9.
Figure 4
Figure 4
Effect of TnC isoforms on stretch-activated tension. Transient tension responses to a rapid 1% step change in length (arrow) were recorded at the plateau of isometric tension, in solutions of decreasing Ca2+. (A) Native fibres, (B) fibres in which TnC was substituted with F1, (C) F1mIV, (D) F2, (E) F2mII. Phases 3 and 4 of the tension response were fitted by the sum of two exponential processes (Thorson and White, 1983), using a least-squares algorithm. Stretch activation is characterised by the amplitude (A3) and rate constant (r3) of phase 3 (see (F) inset). Tension was normalised to fibre cross-sectional area (Dickinson et al, 1997). Ca2+ concentrations (pCa) were: 4.7 (black), 5.5 (red), 5.9 (green), 6.1 (dark blue), 6.3 (sky blue), 6.6 (yellow), 6.9 (wine), relaxing (<pCa 7.5) (yellow ochre). The orange curve is the response at pCa 4.7 after vanadate treatment. (F) Effect of Ca2+ on r3 for native fibres (green) and fibres substituted with F1 (red), F2 (blue) and F2mII (orange). Values are mean±s.d. (n=7) for native fibres, and mean and range (n=2) for substituted fibres. Inset: typical fit of phases 3 and 4 of a stretch-activated tension curve (black) by two exponentials (red and green).
Figure 5
Figure 5
Ca2+ dependence of isometric tension and stretch-activated tension. (A) Native fibres, (B) fibres substituted with F1, (C) F2, (D) F2mII. Isometric tension (grey squares) and stretch-activated tension (black circles) are normalised to the total tension in native fibres at pCa 4.7. Stretch-activated tension is A3 (see Figure 4); total tension is isometric tension+stretch-activated tension. Isometric tension in native fibres at pCa 4.7 is 107±24 kN/m2 (mean±s.d., n=7). Values in (B) (C) and (D) are the mean of two estimations using the same protocol. pCa50 for isometric tension is 5.65±0.35 (n=7) for native fibres and 5.8 for F2-substituted fibres; Hill coefficients are 1.95±0.07 and 2.8, respectively.
Figure 6
Figure 6
Position of F1 and F2 in myofibrils. (A) Western blot of F1 and F2 incubated with anti-F1 (left panel) and anti-F2 (right panel). (B) Lethocerus IFM myofibril double labelled with anti-F1 (rat antibody) and anti-F2 (mouse antibody), followed by FITC anti-rat and Texas red anti-mouse secondary antibodies. Overlay shows that both isoforms are in the same region of the sarcomere. White arrows mark the position of Z-discs. Scale bar 5 μm.
Figure 7
Figure 7
Distribution of F1 and F2 in Lethocerus IFM. Cryosections of the dorsal longitudinal muscle were labelled with anti-F1 (A) or anti-F2 (B) and Protein A gold (10 nm). Scale bar 0.5 μm.

References

    1. Abbott RH (1973) The effects of fibre length and calcium ion concentration on the dynamic response of glycerol extracted insect fibrillar muscle. J Physiol 231: 195–208 - PMC - PubMed
    1. Allhouse LD, Potter JD, Ashley CC (1999) A novel method of extraction of TnC from skeletal muscle myofibrils. Pflügers Arch 437: 695–701 - PubMed
    1. Bers DM, Patton CW, Nuccitelli R (1994) A practical guide to the preparation of Ca2+ buffers. Methods Cell Biol 40: 3–29 - PubMed
    1. Brenner B (1988) Effect of Ca2+ on cross-bridge turnover kinetics in skinned single rabbit psoas fibres: implications for regulation of muscle contraction. Proc Natl Acad Sci USA 88: 3265–3269 - PMC - PubMed
    1. Bullard B, Bell J, Craig R, Leonard K (1985) Arthrin: a new actin-like protein in insect flight muscle. J Mol Biol 182: 443–454 - PubMed

Publication types