. 2004 Feb 25;23(4):939-49.
doi: 10.1038/sj.emboj.7600091. Epub 2004 Feb 5.

In vivo assembly and disassembly of Rad51 and Rad52 complexes during double-strand break repair

Affiliations

In vivo assembly and disassembly of Rad51 and Rad52 complexes during double-strand break repair

Toshiko Miyazaki et al. EMBO J. .

Abstract

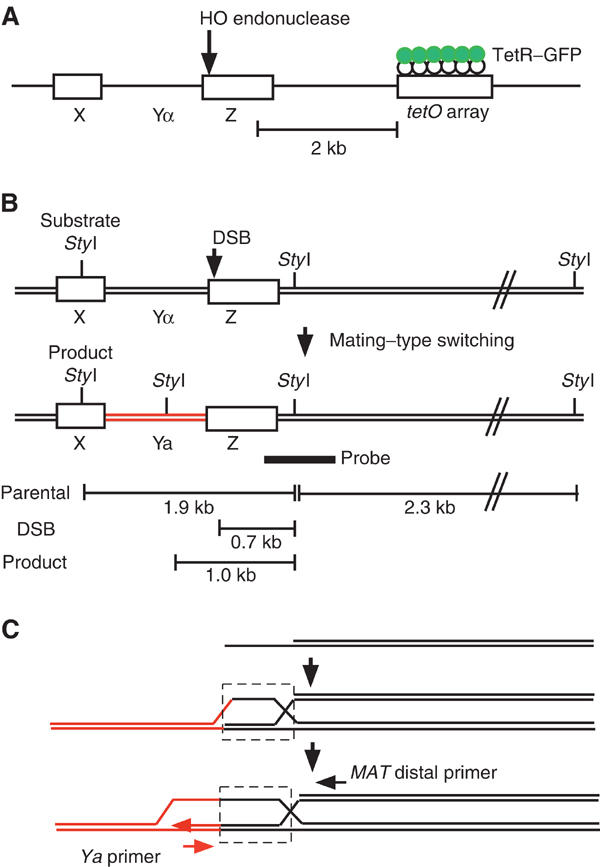
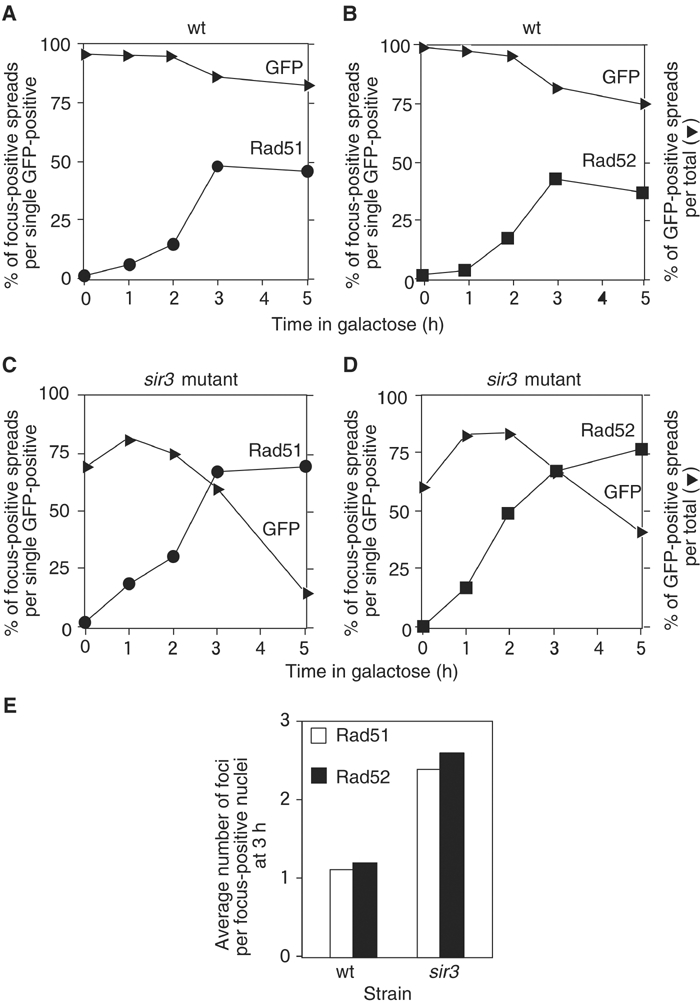
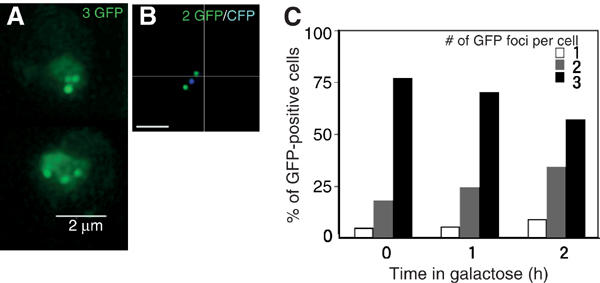
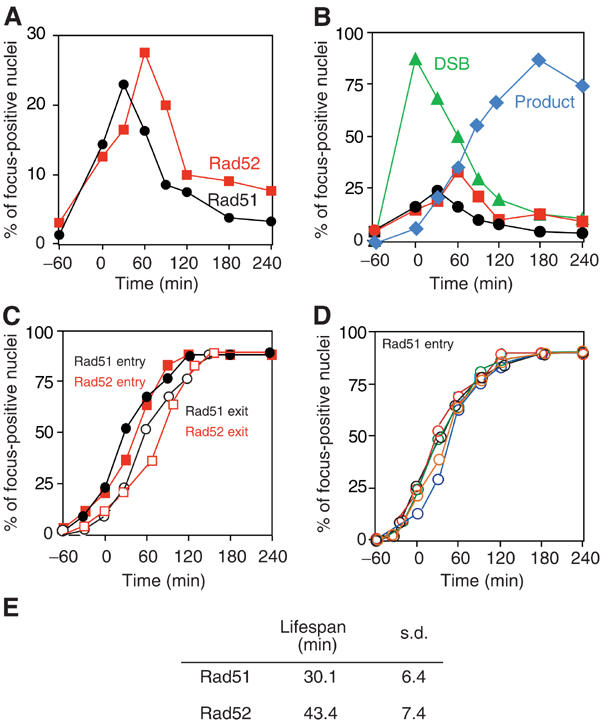
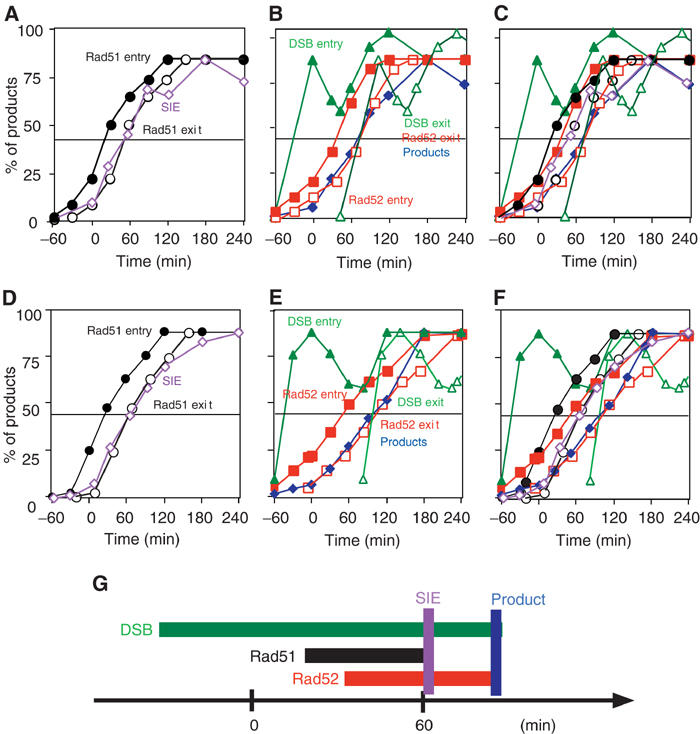
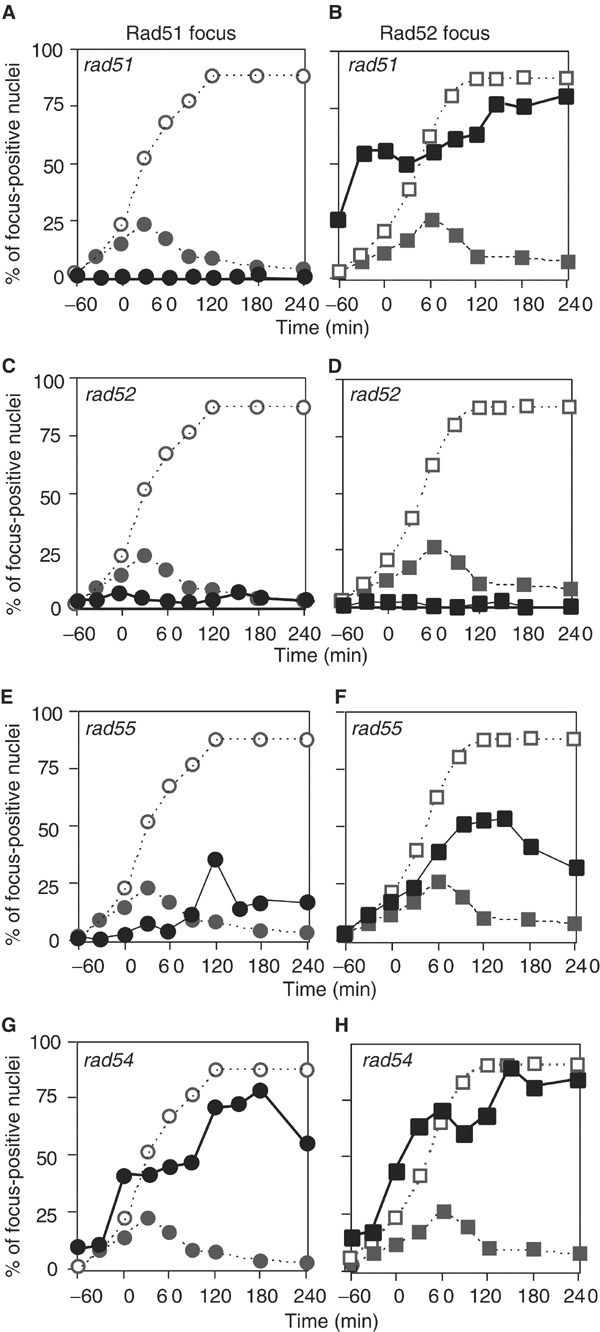
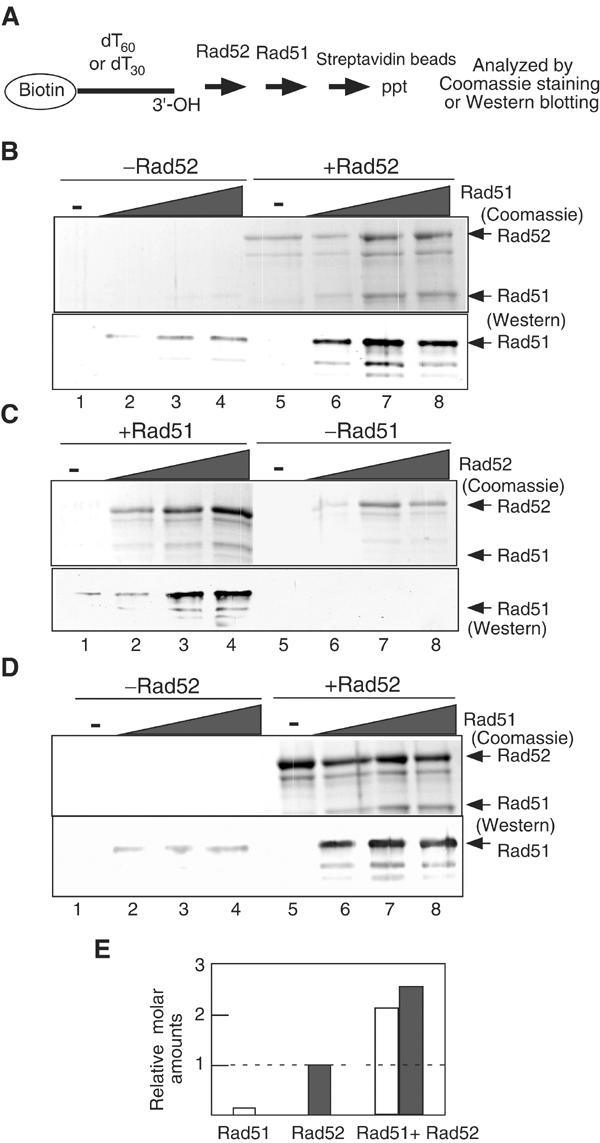
Assembly and disassembly of Rad51 and Rad52 complexes were monitored by immunofluorescence during homologous recombination initiated by an HO endonuclease-induced double-strand break (DSB) at the MAT locus. DSB-induced Rad51 and Rad52 foci colocalize with a TetR-GFP focus at tetO sequences adjacent to MAT. In strains in which HO cleaves three sites on chromosome III, we observe three distinct foci that colocalize with adjacent GFP chromosome marks. We compared the kinetics of focus formation with recombination intermediates and products when HO-cleaved MATalpha recombines with the donor, MATa. Rad51 assembly occurs 1 h after HO cleavage. Rad51 disassembly occurs at the same time that new DNA synthesis is initiated after single-stranded (ss) MAT DNA invades MATa. We present evidence for three distinct roles for Rad52 in recombination: a presynaptic role necessary for Rad51 assembly, a synaptic role with Rad51 filaments, and a postsynaptic role after Rad51 dissociates. Additional biochemical studies suggest the presence of an ssDNA complex containing both Rad51 and Rad52.


Figures

Figure 1
Figure 1
Experimental design. (A) Schematic diagram of the MAT locus visualized by GFP. A tetO array, able to bind TetR–GFP, is located 2 kb distal to the MAT locus. (B) Mating-type switching from MATα to MATa. The location of StyI sites used to monitor DSB formation and products by Southern analysis. (C) PCR analysis of the SIE recombination intermediate.
Figure 2
Figure 2
Rad51 and Rad52 focus formation at the MAT locus. (A–J) wt (YDB057) and sir3 mutants (YDB058 and YDB236) were incubated with and without galactose. YDB057 (A–E) and YDB058 (F, G) contain a GFP-binding site near the MAT locus. YDB236 (H–J) contains three GFP-binding sites on chromosome III. Chromosome spreads were stained with anti-Rad51 (red; A–D, F, H–J) or anti-Rad52 (red; E, G) and anti-GFP (green) antibodies and examined under an epifluorescence microscope. DNA was stained with 4′, 6′-diamidino-2-phenylindole (DAPI; blue). Bars indicate 2 μm. (K, L) Colocalization of Rad51 and Rad52 with the GFP spot. Chromosome spreads from wt (K; YDB057) and the rad54 mutant (L; YTM132) were stained simultaneously with anti-GFP (green), anti-Rad51 (pink), anti-Rad52 (red), and DAPI (blue). Bars indicate 2 μm.
Figure 3
Figure 3
Kinetic analysis of Rad51 and Rad52 foci. (A–D) wt (YDB057; A, B) and the sir3 (YDB058; C, D) cells were exposed to galactose at t=0. At indicated times, chromosome spreads were prepared and stained with either anti-Rad51 (A, C) or anti-Rad52 (B, D) together with anti-GFP. Nuclei containing Rad51 focus (closed circles) or Rad52 focus (closed squares) were counted and percentages per focus-positive nuclei were plotted. Results for one experiment are shown. GFP-positive nuclei (closed rectangles) were also counted and plotted against total nuclei. At least 100 nuclei were analyzed at each time point. (E) The numbers of Rad51 (open bars) and Rad52 (closed bars) foci per focus-positive nuclei at a 3-h incubation were counted and the average numbers of each focus per focus-positive nuclei are shown.
Figure 4
Figure 4
Intact cell analysis of DSB sites marked with GFP and CFP. (A, B) GFP foci (A; YDB236) and GFP and CFP foci (B; YDB244) were observed in intact sir3 cells by 3D fluorescence microscopy. Cells were fixed following a 2-h incubation with galactose. Each image shown is a projection of a series of 16 sections through the cell spaced 0.2 μm apart. Bars indicate 2 μm. (C) The number of GFP foci per focus-positive cell was scored in sir3 cells (YDB236) at indicated times following exposure to galactose. At least 100 focus-positive cells were scored at each time point.
Figure 5
Figure 5
Cumulative analysis of Rad51 and Rad52 foci. (A) wt cells (YDB057) were transiently exposed to galactose for 1 h. At indicated times, chromosome spreads were prepared and stained for Rad51 or Rad52 and GFP. Time 0 is the time when the medium was exchanged. The nuclei containing Rad51 (closed circles) or Rad52 (closed squares) focus per single GFP-positive nuclei were counted. At least 100 nuclei were analyzed at each time point. (B) The kinetics of the foci are compared with that of DSBs and products. Results of experiment #6 are shown: DSBs (closed triangles) and products (closed diamonds). (C) Noncumulative curves of focus positive nuclei were converted into cumulative curves as described in Materials and methods. Rad51 assembly, closed circles; Rad51 disassembly, open circles; Rad52 assembly, closed squares; Rad52 disassembly, open squares. (D) Cumulative curves for Rad51 foci are from five independent experiments. (E) Lifespans of Rad51 and Rad52 foci were calculated from five independent noncumulative curves and the average time of each lifespan was obtained.
Figure 6
Figure 6
Comparison of focus formation with DNA events. Results from two independent time-course analyses (#6, A–C; #7, D–F) are presented. Assembly and disassembly of Rad51 foci are compared with the formation of SIE intermediates (A, D). Assembly and disassembly of Rad52 foci are compared with the formation of product and DSB appearance/disappearance (B, E). All curves of the foci and DNA events are indicated (C, F). The times when half of the cells enter into a particular stage are calculated. A schematic summary for #6 experiment is presented in (G). Rad51 assembly, closed circles; Rad51 disassembly, open circles (black); Rad52 assembly, closed squares; Rad52 disassembly, open squares (red); DSB entry, closed triangles; DSB exit, open triangles (green); SIE formation, open diamonds (purple); products, closed diamonds (blue).
Figure 7
Figure 7
Rad51 and Rad52 focus formation in various mutants. The rad51 (A, B; YTM134), rad52 (C, D; YTM171), rad55 (E, F; YTM167), and rad54 (G, H; YTM132) mutants were analyzed for HO-induced Rad51 and Rad52 focus formation. The DSB was induced by incubating cells in medium containing galactose for 1 h. The percentages of Rad51 (closed circles in A, C, E, G) and Rad52 (closed squares in B, D, F, H) focus-positive nuclei were plotted against total nuclei. In each figure, noncumulative (closed circles or squares) and cumulative curves (open circles or squares) of the focus in wt are indicated as dotted lines.
Figure 8
Figure 8
In vitro complex formation of Rad51–Rad52–ssDNA. (A) Schematic diagram of the assay. (B) Rad52 protein (1 μM) was incubated with a reaction mixture containing 3 μM (nucleotide) biotinylated-dT60 for 5 min, followed by the addition of various concentrations of Rad51 protein. After a 10-min incubation, the ssDNA complexes were purified and further processed as described in Materials and methods. One-tenth of the eluates were analyzed with Western blotting. Upper panel, Coomassie staining; lower panel, Western blotting using anti-Rad51 antibody. Lanes 1–4, in the absence of Rad52; lanes 5–8, in the presence of 1 μM Rad52. Lanes 1 and 5, no Rad51; lanes 2 and 6, 0.25 μM Rad51; lanes 3 and 7, 0.5 μM Rad51; lanes 4 and 8, 1.0 μM Rad51. (C) Various concentrations of Rad52 were incubated with 3 μM biotinated-dT60 for 5 min, followed by the addition of 1 μM Rad51. After a 10-min incubation, the mixtures were analyzed as described in Materials and methods. Upper panel, Coomassie staining; lower panel, Western blotting. Lanes 1–4, in the presence of 1 μM Rad51; lanes 5–8, in the absence of Rad51. Lanes 1 and 5, no Rad52; lanes 2 and 6, 0.25 μM Rad52; lanes 3 and 7, 0.5 μM Rad52; lanes 4 and 8, 1.0 μM Rad52. (D) Same as for (B) except 3 μM biotinated-dT30 was substituted for biotinated-dT60. Upper panel, Coomassie staining; lower panel, Western blotting. (E) The relative molar amounts of proteins bound to 3 μM biotinated-dT60 were quantified (B). Rad51 (1 μM) and/or Rad52 (1 μM) were used.

Similar articles

Cited by

References

    1. Baumann P, West SC (1999) Heteroduplex formation by human Rad51 protein: effects of DNA end-structure, hRP-A and hRad52. J Mol Biol 291: 363–374 - PubMed
    1. Benson FE, Baumann P, West SC (1998) Synergistic actions of Rad51 and Rad52 in recombination and DNA repair. Nature 391: 401–404 - PubMed
    1. Bishop DK (1994) RecA homologs Dmc1 and Rad51 interact to form multiple nuclear complexes prior to meiotic chromosome synapsis. Cell 79: 1081–1092 - PubMed
    1. Bressan DA, Vazquez J, Haber JE (2004) Mating type-dependent constraints on the mobility of the left arm of yeast chromosome III. J Cell Biol 164: in press - PMC - PubMed
    1. Fortin GS, Symington LS (2002) Mutations in yeast Rad51 that partially bypass the requirement for Rad55 and Rad57 in DNA repair by increasing the stability of Rad51–DNA complexes. EMBO J 21: 3160–3170 - PMC - PubMed

MeSH terms

Substances